Immigrants from Sri Lanka vs Estonian In Labor Force | Age 16-19
COMPARE
Immigrants from Sri Lanka
Estonian
In Labor Force | Age 16-19
In Labor Force | Age 16-19 Comparison
Immigrants from Sri Lanka
Estonians
34.9%
IN LABOR FORCE | AGE 16-19
2.4/ 100
METRIC RATING
246th/ 347
METRIC RANK
37.7%
IN LABOR FORCE | AGE 16-19
91.7/ 100
METRIC RATING
140th/ 347
METRIC RANK
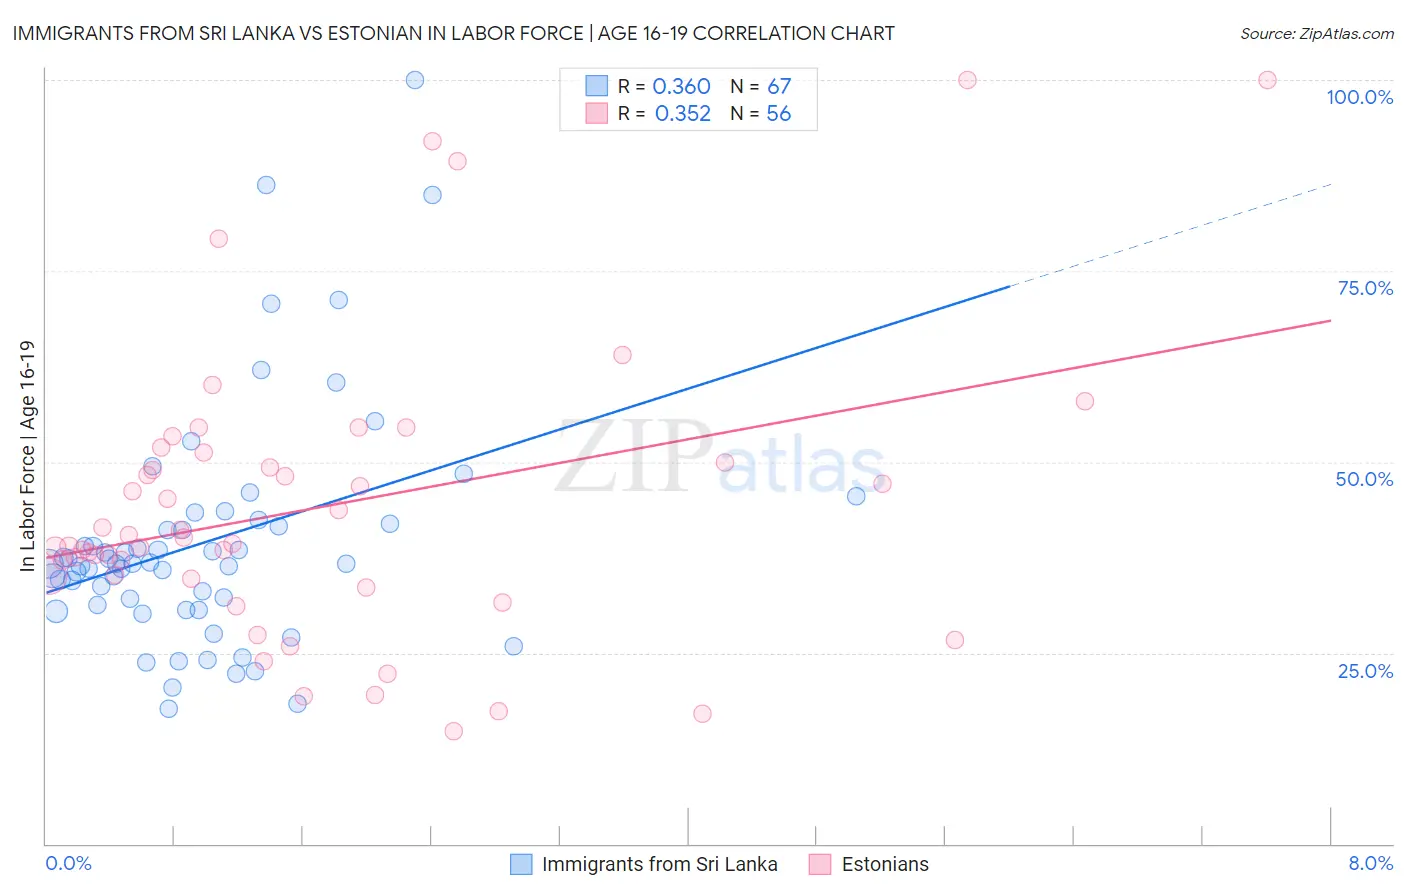
Immigrants from Sri Lanka vs Estonian In Labor Force | Age 16-19 Correlation Chart
The statistical analysis conducted on geographies consisting of 149,654,702 people shows a mild positive correlation between the proportion of Immigrants from Sri Lanka and labor force participation rate among population between the ages 16 and 19 in the United States with a correlation coefficient (R) of 0.360 and weighted average of 34.9%. Similarly, the statistical analysis conducted on geographies consisting of 123,400,045 people shows a mild positive correlation between the proportion of Estonians and labor force participation rate among population between the ages 16 and 19 in the United States with a correlation coefficient (R) of 0.352 and weighted average of 37.7%, a difference of 8.1%.
In Labor Force | Age 16-19 Correlation Summary
| Measurement | Immigrants from Sri Lanka | Estonian |
| Minimum | 17.6% | 14.8% |
| Maximum | 100.0% | 100.0% |
| Range | 82.4% | 85.2% |
| Mean | 39.5% | 44.2% |
| Median | 36.7% | 39.7% |
| Interquartile 25% (IQ1) | 31.2% | 34.9% |
| Interquartile 75% (IQ3) | 41.9% | 50.6% |
| Interquartile Range (IQR) | 10.7% | 15.8% |
| Standard Deviation (Sample) | 15.4% | 19.0% |
| Standard Deviation (Population) | 15.3% | 18.8% |
Similar Demographics by In Labor Force | Age 16-19
Demographics Similar to Immigrants from Sri Lanka by In Labor Force | Age 16-19
In terms of in labor force | age 16-19, the demographic groups most similar to Immigrants from Sri Lanka are Laotian (34.9%, a difference of 0.010%), Immigrants from Greece (34.9%, a difference of 0.020%), Immigrants from Turkey (34.9%, a difference of 0.080%), Central American (34.8%, a difference of 0.090%), and Pueblo (34.9%, a difference of 0.10%).
| Demographics | Rating | Rank | In Labor Force | Age 16-19 |
| Inupiat | 3.2 /100 | #239 | Tragic 35.0% |
| Immigrants | Central America | 3.0 /100 | #240 | Tragic 35.0% |
| Immigrants | Ireland | 2.9 /100 | #241 | Tragic 35.0% |
| Uruguayans | 2.6 /100 | #242 | Tragic 34.9% |
| Pueblo | 2.6 /100 | #243 | Tragic 34.9% |
| Immigrants | Turkey | 2.6 /100 | #244 | Tragic 34.9% |
| Immigrants | Greece | 2.4 /100 | #245 | Tragic 34.9% |
| Immigrants | Sri Lanka | 2.4 /100 | #246 | Tragic 34.9% |
| Laotians | 2.4 /100 | #247 | Tragic 34.9% |
| Central Americans | 2.2 /100 | #248 | Tragic 34.8% |
| Immigrants | Ukraine | 2.2 /100 | #249 | Tragic 34.8% |
| Immigrants | Pakistan | 2.0 /100 | #250 | Tragic 34.8% |
| Immigrants | Western Asia | 2.0 /100 | #251 | Tragic 34.8% |
| Immigrants | Chile | 2.0 /100 | #252 | Tragic 34.8% |
| Immigrants | Japan | 1.5 /100 | #253 | Tragic 34.7% |
Demographics Similar to Estonians by In Labor Force | Age 16-19
In terms of in labor force | age 16-19, the demographic groups most similar to Estonians are Immigrants from Moldova (37.7%, a difference of 0.030%), Comanche (37.7%, a difference of 0.050%), Syrian (37.6%, a difference of 0.14%), Cajun (37.8%, a difference of 0.27%), and Australian (37.8%, a difference of 0.28%).
| Demographics | Rating | Rank | In Labor Force | Age 16-19 |
| Cheyenne | 94.6 /100 | #133 | Exceptional 37.9% |
| Immigrants | Netherlands | 93.7 /100 | #134 | Exceptional 37.8% |
| Macedonians | 93.4 /100 | #135 | Exceptional 37.8% |
| Australians | 93.2 /100 | #136 | Exceptional 37.8% |
| Cajuns | 93.2 /100 | #137 | Exceptional 37.8% |
| Comanche | 91.9 /100 | #138 | Exceptional 37.7% |
| Immigrants | Moldova | 91.9 /100 | #139 | Exceptional 37.7% |
| Estonians | 91.7 /100 | #140 | Exceptional 37.7% |
| Syrians | 90.7 /100 | #141 | Exceptional 37.6% |
| Sierra Leoneans | 89.7 /100 | #142 | Excellent 37.6% |
| Pakistanis | 89.5 /100 | #143 | Excellent 37.6% |
| Japanese | 89.3 /100 | #144 | Excellent 37.5% |
| Paiute | 89.3 /100 | #145 | Excellent 37.5% |
| Immigrants | Western Europe | 88.9 /100 | #146 | Excellent 37.5% |
| Brazilians | 88.7 /100 | #147 | Excellent 37.5% |