Immigrants from Spain vs Immigrants from Europe In Labor Force | Age 45-54
COMPARE
Immigrants from Spain
Immigrants from Europe
In Labor Force | Age 45-54
In Labor Force | Age 45-54 Comparison
Immigrants from Spain
Immigrants from Europe
83.0%
IN LABOR FORCE | AGE 45-54
80.4/ 100
METRIC RATING
137th/ 347
METRIC RANK
83.2%
IN LABOR FORCE | AGE 45-54
90.7/ 100
METRIC RATING
118th/ 347
METRIC RANK
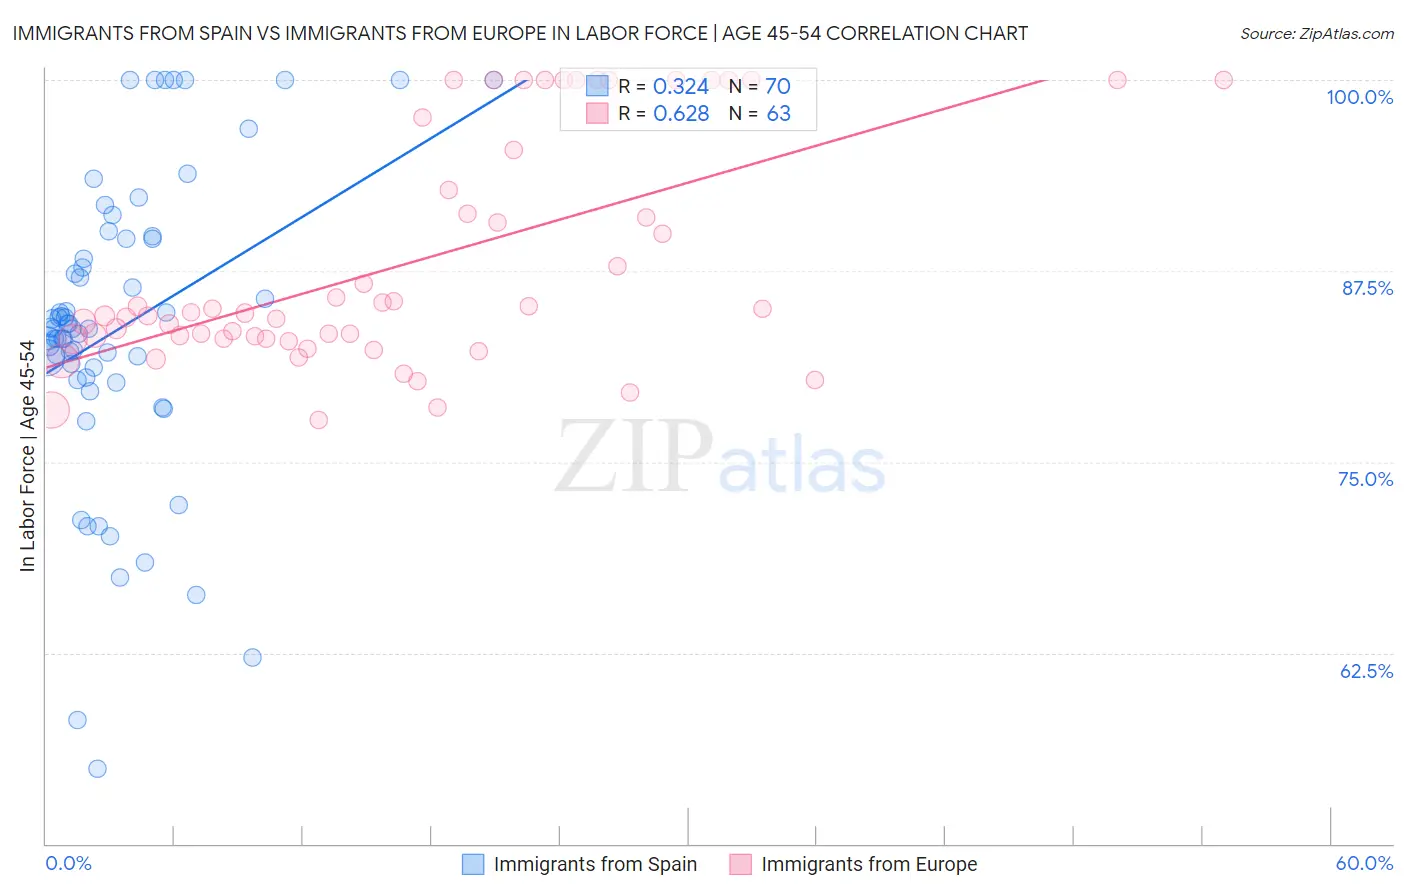
Immigrants from Spain vs Immigrants from Europe In Labor Force | Age 45-54 Correlation Chart
The statistical analysis conducted on geographies consisting of 239,591,563 people shows a mild positive correlation between the proportion of Immigrants from Spain and labor force participation rate among population between the ages 45 and 54 in the United States with a correlation coefficient (R) of 0.324 and weighted average of 83.0%. Similarly, the statistical analysis conducted on geographies consisting of 546,802,439 people shows a significant positive correlation between the proportion of Immigrants from Europe and labor force participation rate among population between the ages 45 and 54 in the United States with a correlation coefficient (R) of 0.628 and weighted average of 83.2%, a difference of 0.19%.
In Labor Force | Age 45-54 Correlation Summary
| Measurement | Immigrants from Spain | Immigrants from Europe |
| Minimum | 54.9% | 77.7% |
| Maximum | 100.0% | 100.0% |
| Range | 45.1% | 22.3% |
| Mean | 83.7% | 88.0% |
| Median | 83.7% | 84.7% |
| Interquartile 25% (IQ1) | 80.5% | 83.1% |
| Interquartile 75% (IQ3) | 89.6% | 95.5% |
| Interquartile Range (IQR) | 9.1% | 12.4% |
| Standard Deviation (Sample) | 9.8% | 7.4% |
| Standard Deviation (Population) | 9.7% | 7.3% |
Demographics Similar to Immigrants from Spain and Immigrants from Europe by In Labor Force | Age 45-54
In terms of in labor force | age 45-54, the demographic groups most similar to Immigrants from Spain are Austrian (83.0%, a difference of 0.010%), Immigrants from Kazakhstan (83.0%, a difference of 0.010%), Sudanese (83.0%, a difference of 0.020%), Liberian (83.0%, a difference of 0.030%), and Finnish (83.1%, a difference of 0.040%). Similarly, the demographic groups most similar to Immigrants from Europe are Immigrants from China (83.2%, a difference of 0.010%), Immigrants from Uruguay (83.2%, a difference of 0.010%), Immigrants from Russia (83.2%, a difference of 0.010%), Uruguayan (83.1%, a difference of 0.030%), and Immigrants from Vietnam (83.1%, a difference of 0.040%).
| Demographics | Rating | Rank | In Labor Force | Age 45-54 |
| Immigrants | China | 90.9 /100 | #117 | Exceptional 83.2% |
| Immigrants | Europe | 90.7 /100 | #118 | Exceptional 83.2% |
| Immigrants | Uruguay | 90.2 /100 | #119 | Exceptional 83.2% |
| Immigrants | Russia | 90.1 /100 | #120 | Exceptional 83.2% |
| Uruguayans | 89.4 /100 | #121 | Excellent 83.1% |
| Immigrants | Vietnam | 88.9 /100 | #122 | Excellent 83.1% |
| Tongans | 88.2 /100 | #123 | Excellent 83.1% |
| Bermudans | 88.0 /100 | #124 | Excellent 83.1% |
| Immigrants | Iran | 87.2 /100 | #125 | Excellent 83.1% |
| Immigrants | Belgium | 86.4 /100 | #126 | Excellent 83.1% |
| Immigrants | Jordan | 85.2 /100 | #127 | Excellent 83.1% |
| Germans | 85.1 /100 | #128 | Excellent 83.1% |
| Immigrants | Northern Europe | 85.1 /100 | #129 | Excellent 83.1% |
| Immigrants | Israel | 84.7 /100 | #130 | Excellent 83.1% |
| Finns | 83.3 /100 | #131 | Excellent 83.1% |
| Immigrants | Ukraine | 82.9 /100 | #132 | Excellent 83.0% |
| Liberians | 82.7 /100 | #133 | Excellent 83.0% |
| Sudanese | 82.0 /100 | #134 | Excellent 83.0% |
| Austrians | 81.3 /100 | #135 | Excellent 83.0% |
| Immigrants | Kazakhstan | 81.0 /100 | #136 | Excellent 83.0% |
| Immigrants | Spain | 80.4 /100 | #137 | Excellent 83.0% |