Immigrants from Southern Europe vs Liberian In Labor Force | Age 20-64
COMPARE
Immigrants from Southern Europe
Liberian
In Labor Force | Age 20-64
In Labor Force | Age 20-64 Comparison
Immigrants from Southern Europe
Liberians
79.8%
IN LABOR FORCE | AGE 20-64
78.9/ 100
METRIC RATING
146th/ 347
METRIC RANK
80.9%
IN LABOR FORCE | AGE 20-64
100.0/ 100
METRIC RATING
21st/ 347
METRIC RANK
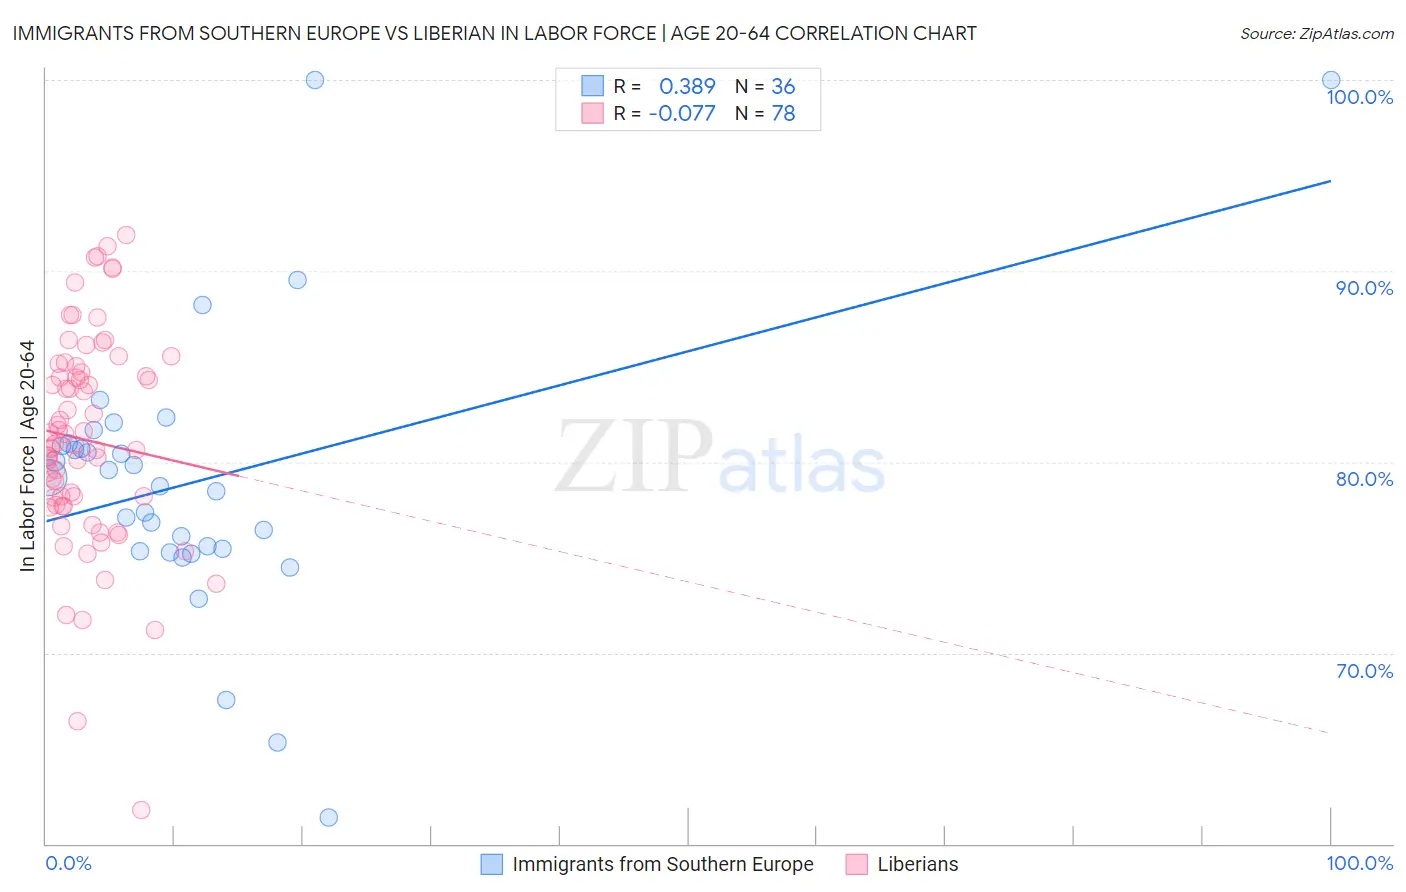
Immigrants from Southern Europe vs Liberian In Labor Force | Age 20-64 Correlation Chart
The statistical analysis conducted on geographies consisting of 402,797,252 people shows a mild positive correlation between the proportion of Immigrants from Southern Europe and labor force participation rate among population between the ages 20 and 64 in the United States with a correlation coefficient (R) of 0.389 and weighted average of 79.8%. Similarly, the statistical analysis conducted on geographies consisting of 118,097,222 people shows a slight negative correlation between the proportion of Liberians and labor force participation rate among population between the ages 20 and 64 in the United States with a correlation coefficient (R) of -0.077 and weighted average of 80.9%, a difference of 1.4%.
In Labor Force | Age 20-64 Correlation Summary
| Measurement | Immigrants from Southern Europe | Liberian |
| Minimum | 61.4% | 61.8% |
| Maximum | 100.0% | 91.9% |
| Range | 38.6% | 30.1% |
| Mean | 79.0% | 81.1% |
| Median | 79.0% | 80.9% |
| Interquartile 25% (IQ1) | 75.4% | 77.7% |
| Interquartile 75% (IQ3) | 80.9% | 84.7% |
| Interquartile Range (IQR) | 5.5% | 7.0% |
| Standard Deviation (Sample) | 7.4% | 5.6% |
| Standard Deviation (Population) | 7.3% | 5.5% |
Similar Demographics by In Labor Force | Age 20-64
Demographics Similar to Immigrants from Southern Europe by In Labor Force | Age 20-64
In terms of in labor force | age 20-64, the demographic groups most similar to Immigrants from Southern Europe are Pakistani (79.8%, a difference of 0.0%), Immigrants from Israel (79.8%, a difference of 0.010%), Slovak (79.8%, a difference of 0.010%), Immigrants from Sweden (79.8%, a difference of 0.010%), and Korean (79.8%, a difference of 0.010%).
| Demographics | Rating | Rank | In Labor Force | Age 20-64 |
| Immigrants | Spain | 83.9 /100 | #139 | Excellent 79.8% |
| Immigrants | South Eastern Asia | 80.4 /100 | #140 | Excellent 79.8% |
| Immigrants | Israel | 80.0 /100 | #141 | Good 79.8% |
| Slovaks | 79.9 /100 | #142 | Good 79.8% |
| Immigrants | Sweden | 79.7 /100 | #143 | Good 79.8% |
| Koreans | 79.6 /100 | #144 | Good 79.8% |
| Pakistanis | 79.3 /100 | #145 | Good 79.8% |
| Immigrants | Southern Europe | 78.9 /100 | #146 | Good 79.8% |
| Immigrants | Philippines | 78.0 /100 | #147 | Good 79.8% |
| Romanians | 77.6 /100 | #148 | Good 79.8% |
| Icelanders | 75.1 /100 | #149 | Good 79.7% |
| Costa Ricans | 72.4 /100 | #150 | Good 79.7% |
| Scandinavians | 72.0 /100 | #151 | Good 79.7% |
| Immigrants | Northern Europe | 72.0 /100 | #152 | Good 79.7% |
| Immigrants | Kazakhstan | 69.5 /100 | #153 | Good 79.7% |
Demographics Similar to Liberians by In Labor Force | Age 20-64
In terms of in labor force | age 20-64, the demographic groups most similar to Liberians are Thai (80.9%, a difference of 0.020%), Immigrants from Bulgaria (81.0%, a difference of 0.070%), Zimbabwean (81.0%, a difference of 0.070%), Sudanese (80.8%, a difference of 0.070%), and Norwegian (81.0%, a difference of 0.080%).
| Demographics | Rating | Rank | In Labor Force | Age 20-64 |
| Cambodians | 100.0 /100 | #14 | Exceptional 81.1% |
| Bulgarians | 100.0 /100 | #15 | Exceptional 81.1% |
| Immigrants | Nepal | 100.0 /100 | #16 | Exceptional 81.1% |
| Norwegians | 100.0 /100 | #17 | Exceptional 81.0% |
| Immigrants | Bulgaria | 100.0 /100 | #18 | Exceptional 81.0% |
| Zimbabweans | 100.0 /100 | #19 | Exceptional 81.0% |
| Thais | 100.0 /100 | #20 | Exceptional 80.9% |
| Liberians | 100.0 /100 | #21 | Exceptional 80.9% |
| Sudanese | 100.0 /100 | #22 | Exceptional 80.8% |
| Immigrants | Bosnia and Herzegovina | 100.0 /100 | #23 | Exceptional 80.8% |
| Immigrants | Morocco | 100.0 /100 | #24 | Exceptional 80.8% |
| Kenyans | 100.0 /100 | #25 | Exceptional 80.8% |
| Immigrants | Serbia | 100.0 /100 | #26 | Exceptional 80.8% |
| Immigrants | Kenya | 99.9 /100 | #27 | Exceptional 80.7% |
| Immigrants | Uganda | 99.9 /100 | #28 | Exceptional 80.7% |