Immigrants from South Africa vs Korean In Labor Force | Age 45-54
COMPARE
Immigrants from South Africa
Korean
In Labor Force | Age 45-54
In Labor Force | Age 45-54 Comparison
Immigrants from South Africa
Koreans
82.8%
IN LABOR FORCE | AGE 45-54
55.8/ 100
METRIC RATING
168th/ 347
METRIC RANK
82.9%
IN LABOR FORCE | AGE 45-54
71.9/ 100
METRIC RATING
151st/ 347
METRIC RANK
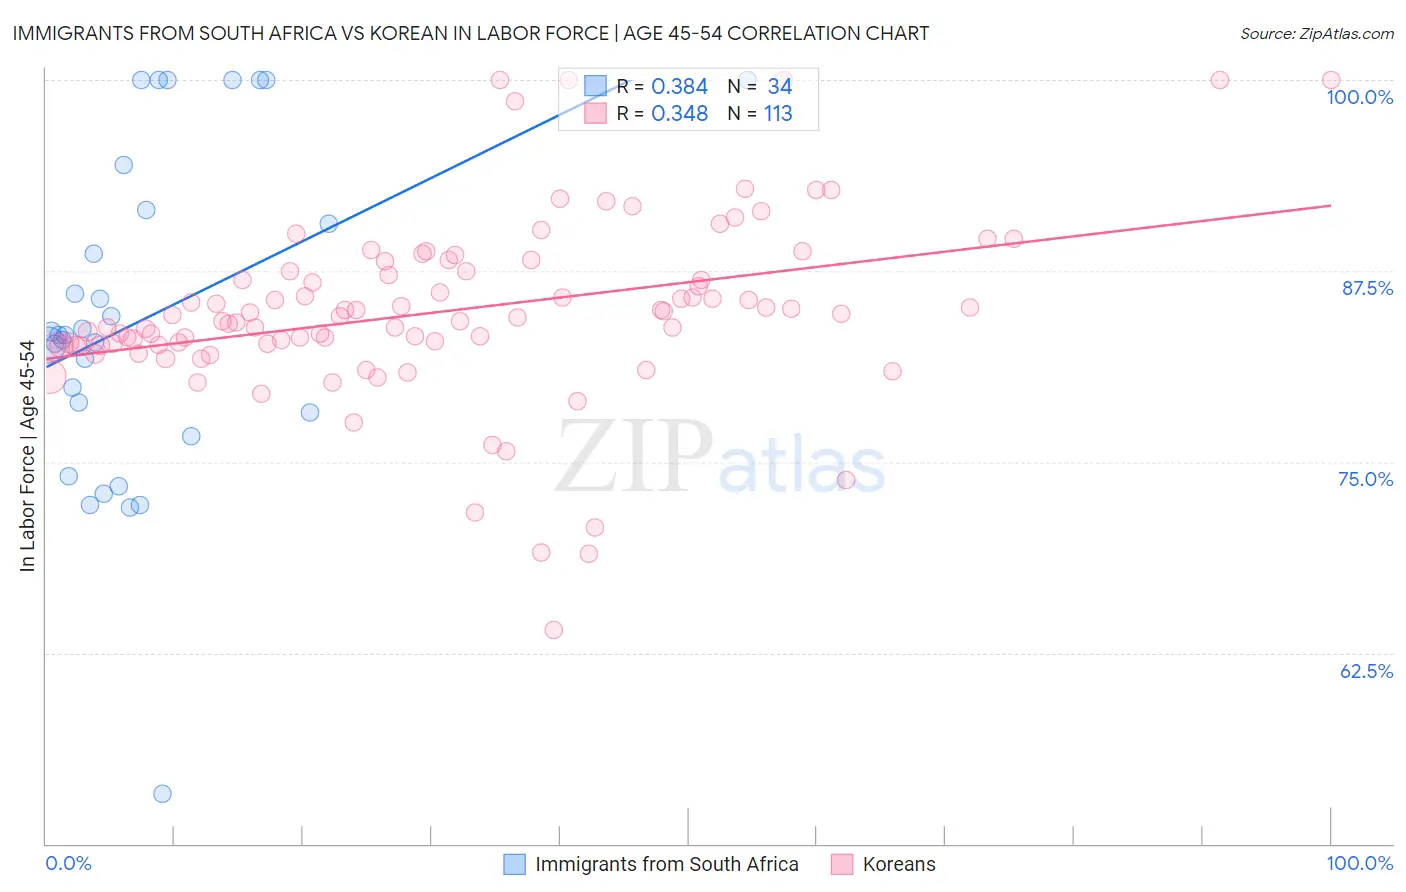
Immigrants from South Africa vs Korean In Labor Force | Age 45-54 Correlation Chart
The statistical analysis conducted on geographies consisting of 233,265,537 people shows a mild positive correlation between the proportion of Immigrants from South Africa and labor force participation rate among population between the ages 45 and 54 in the United States with a correlation coefficient (R) of 0.384 and weighted average of 82.8%. Similarly, the statistical analysis conducted on geographies consisting of 510,364,198 people shows a mild positive correlation between the proportion of Koreans and labor force participation rate among population between the ages 45 and 54 in the United States with a correlation coefficient (R) of 0.348 and weighted average of 82.9%, a difference of 0.16%.
In Labor Force | Age 45-54 Correlation Summary
| Measurement | Immigrants from South Africa | Korean |
| Minimum | 53.3% | 64.0% |
| Maximum | 100.0% | 100.0% |
| Range | 46.7% | 36.0% |
| Mean | 84.5% | 84.8% |
| Median | 83.3% | 84.5% |
| Interquartile 25% (IQ1) | 78.2% | 82.6% |
| Interquartile 75% (IQ3) | 91.5% | 87.5% |
| Interquartile Range (IQR) | 13.3% | 4.9% |
| Standard Deviation (Sample) | 10.8% | 6.0% |
| Standard Deviation (Population) | 10.7% | 6.0% |
Demographics Similar to Immigrants from South Africa and Koreans by In Labor Force | Age 45-54
In terms of in labor force | age 45-54, the demographic groups most similar to Immigrants from South Africa are Immigrants from South Eastern Asia (82.8%, a difference of 0.010%), Swiss (82.8%, a difference of 0.010%), Immigrants from Western Africa (82.8%, a difference of 0.010%), Immigrants from Sudan (82.8%, a difference of 0.040%), and Haitian (82.8%, a difference of 0.050%). Similarly, the demographic groups most similar to Koreans are Immigrants from Sweden (82.9%, a difference of 0.010%), Immigrants from Netherlands (82.9%, a difference of 0.010%), Slavic (82.9%, a difference of 0.010%), Immigrants from Indonesia (82.9%, a difference of 0.010%), and Immigrants from Ghana (82.9%, a difference of 0.020%).
| Demographics | Rating | Rank | In Labor Force | Age 45-54 |
| Immigrants | Sweden | 73.3 /100 | #149 | Good 82.9% |
| Immigrants | Netherlands | 72.6 /100 | #150 | Good 82.9% |
| Koreans | 71.9 /100 | #151 | Good 82.9% |
| Slavs | 71.5 /100 | #152 | Good 82.9% |
| Immigrants | Indonesia | 70.6 /100 | #153 | Good 82.9% |
| Immigrants | Ghana | 70.3 /100 | #154 | Good 82.9% |
| Immigrants | Philippines | 69.0 /100 | #155 | Good 82.9% |
| Immigrants | Saudi Arabia | 68.8 /100 | #156 | Good 82.9% |
| Immigrants | Australia | 68.2 /100 | #157 | Good 82.9% |
| Immigrants | Southern Europe | 67.8 /100 | #158 | Good 82.9% |
| Immigrants | Austria | 64.6 /100 | #159 | Good 82.9% |
| Laotians | 62.8 /100 | #160 | Good 82.9% |
| South American Indians | 62.2 /100 | #161 | Good 82.9% |
| Haitians | 61.8 /100 | #162 | Good 82.8% |
| Dutch | 61.7 /100 | #163 | Good 82.8% |
| German Russians | 61.3 /100 | #164 | Good 82.8% |
| Immigrants | Sudan | 59.9 /100 | #165 | Average 82.8% |
| Immigrants | South Eastern Asia | 57.4 /100 | #166 | Average 82.8% |
| Swiss | 56.5 /100 | #167 | Average 82.8% |
| Immigrants | South Africa | 55.8 /100 | #168 | Average 82.8% |
| Immigrants | Western Africa | 54.1 /100 | #169 | Average 82.8% |