Immigrants from Somalia vs Somali In Labor Force | Age 30-34

COMPARE

Immigrants from Somalia
Race
Ancestry
AfghanAfricanAlaska NativeAlaskan AthabascanAlbanianAleutAlsatianAmericanApacheArabArapahoArgentineanArmenianAssyrian/Chaldean/SyriacAustralianAustrianBahamianBangladeshiBarbadianBasqueBelgianBelizeanBermudanBhutaneseBlackfeetBolivianBrazilianBritishBritish West IndianBulgarianBurmeseCajunCambodianCanadianCape VerdeanCarpatho RusynCelticCentral AmericanCentral American IndianCherokeeCheyenneChickasawChileanChineseChippewaChoctawColombianColvilleComancheCosta RicanCreeCreekCroatianCrowCubanCypriotCzechCzechoslovakianDanishDelawareDominicanDutchDutch West IndianEastern EuropeanEcuadorianEgyptianEnglishEstonianEthiopianEuropeanFijianFilipinoFinnishFrenchFrench American IndianFrench CanadianGermanGerman RussianGhanaianGreekGuamanian/ChamorroGuatemalanGuyaneseHaitianHmongHonduranHopiHoumaHungarianIcelanderIndian (Asian)IndonesianInupiatIranianIraqiIrishIroquoisIsraeliItalianJamaicanJapaneseJordanianKenyanKiowaKoreanLaotianLatvianLebaneseLiberianLithuanianLumbeeLuxembourgerMacedonianMalaysianMalteseMarshalleseMenomineeMexicanMexican American IndianMongolianMoroccanNative HawaiianNavajoNepaleseNew ZealanderNicaraguanNigerianNorthern EuropeanNorwegianOkinawanOsageOttawaPaiutePakistaniPalestinianPanamanianParaguayanPennsylvania GermanPeruvianPimaPolishPortuguesePotawatomiPuebloPuerto RicanPuget Sound SalishRomanianRussianSalvadoranSamoanScandinavianScotch-IrishScottishSeminoleSenegaleseSerbianShoshoneSierra LeoneanSiouxSlavicSlovakSloveneSouth AfricanSouth AmericanSouth American IndianSoviet UnionSpaniardSpanishSpanish AmericanSpanish American IndianSri LankanSubsaharan AfricanSudaneseSwedishSwissSyrianTaiwaneseThaiTlingit-HaidaTohono O'OdhamTonganTrinidadian and TobagonianTsimshianTurkishU.S. Virgin IslanderUgandanUkrainianUruguayanUteVenezuelanVietnameseWelshWest IndianYakamaYaquiYugoslavianYumanYup'ikZimbabwean
Immigration
NonimmigrantsImmigrantsAfghanistanAfricaAlbaniaArgentinaArmeniaAsiaAustraliaAustriaBahamasBangladeshBarbadosBelarusBelgiumBelizeBoliviaBosnia and HerzegovinaBrazilBulgariaBurma/MyanmarCabo VerdeCambodiaCameroonCanadaCaribbeanCentral AmericaChileChinaColombiaCongoCosta RicaCroatiaCubaCzechoslovakiaDenmarkDominicaDominican RepublicEastern AfricaEastern AsiaEastern EuropeEcuadorEgyptEl SalvadorEnglandEritreaEthiopiaEuropeFijiFranceGermanyGhanaGreeceGrenadaGuatemalaGuyanaHaitiHondurasHong KongHungaryIndiaIndonesiaIranIraqIrelandIsraelItalyJamaicaJapanJordanKazakhstanKenyaKoreaKuwaitLaosLatin AmericaLatviaLebanonLiberiaLithuaniaMalaysiaMexicoMicronesiaMiddle AfricaMoldovaMoroccoNepalNetherlandsNicaraguaNigeriaNorth AmericaNorth MacedoniaNorthern AfricaNorthern EuropeNorwayOceaniaPakistanPanamaPeruPhilippinesPolandPortugalRomaniaRussiaSaudi ArabiaScotlandSenegalSerbiaSierra LeoneSingaporeSomaliaSouth AfricaSouth AmericaSouth Central AsiaSouth Eastern AsiaSouthern EuropeSpainSri LankaSt. Vincent and the GrenadinesSudanSwedenSwitzerlandSyriaTaiwanThailandTrinidad and TobagoTurkeyUgandaUkraineUruguayUzbekistanVenezuelaVietnamWest IndiesWestern AfricaWestern AsiaWestern EuropeYemenZaireZimbabweAzores
Somali
Race
Ancestry
AfghanAfricanAlaska NativeAlaskan AthabascanAlbanianAleutAlsatianAmericanApacheArabArapahoArgentineanArmenianAssyrian/Chaldean/SyriacAustralianAustrianBahamianBangladeshiBarbadianBasqueBelgianBelizeanBermudanBhutaneseBlackfeetBolivianBrazilianBritishBritish West IndianBulgarianBurmeseCajunCambodianCanadianCape VerdeanCarpatho RusynCelticCentral AmericanCentral American IndianCherokeeCheyenneChickasawChileanChineseChippewaChoctawColombianColvilleComancheCosta RicanCreeCreekCroatianCrowCubanCypriotCzechCzechoslovakianDanishDelawareDominicanDutchDutch West IndianEastern EuropeanEcuadorianEgyptianEnglishEstonianEthiopianEuropeanFijianFilipinoFinnishFrenchFrench American IndianFrench CanadianGermanGerman RussianGhanaianGreekGuamanian/ChamorroGuatemalanGuyaneseHaitianHmongHonduranHopiHoumaHungarianIcelanderIndian (Asian)IndonesianInupiatIranianIraqiIrishIroquoisIsraeliItalianJamaicanJapaneseJordanianKenyanKiowaKoreanLaotianLatvianLebaneseLiberianLithuanianLumbeeLuxembourgerMacedonianMalaysianMalteseMarshalleseMenomineeMexicanMexican American IndianMongolianMoroccanNative HawaiianNavajoNepaleseNew ZealanderNicaraguanNigerianNorthern EuropeanNorwegianOkinawanOsageOttawaPaiutePakistaniPalestinianPanamanianParaguayanPennsylvania GermanPeruvianPimaPolishPortuguesePotawatomiPuebloPuerto RicanPuget Sound SalishRomanianRussianSalvadoranSamoanScandinavianScotch-IrishScottishSeminoleSenegaleseSerbianShoshoneSierra LeoneanSiouxSlavicSlovakSloveneSomaliSouth AfricanSouth AmericanSouth American IndianSoviet UnionSpaniardSpanishSpanish AmericanSpanish American IndianSri LankanSubsaharan AfricanSudaneseSwedishSwissSyrianTaiwaneseThaiTlingit-HaidaTohono O'OdhamTonganTrinidadian and TobagonianTsimshianTurkishU.S. Virgin IslanderUgandanUkrainianUruguayanUteVenezuelanVietnameseWelshWest IndianYakamaYaquiYugoslavianYumanYup'ikZimbabwean
Immigration
NonimmigrantsImmigrantsAfghanistanAfricaAlbaniaArgentinaArmeniaAsiaAustraliaAustriaBahamasBangladeshBarbadosBelarusBelgiumBelizeBoliviaBosnia and HerzegovinaBrazilBulgariaBurma/MyanmarCabo VerdeCambodiaCameroonCanadaCaribbeanCentral AmericaChileChinaColombiaCongoCosta RicaCroatiaCubaCzechoslovakiaDenmarkDominicaDominican RepublicEastern AfricaEastern AsiaEastern EuropeEcuadorEgyptEl SalvadorEnglandEritreaEthiopiaEuropeFijiFranceGermanyGhanaGreeceGrenadaGuatemalaGuyanaHaitiHondurasHong KongHungaryIndiaIndonesiaIranIraqIrelandIsraelItalyJamaicaJapanJordanKazakhstanKenyaKoreaKuwaitLaosLatin AmericaLatviaLebanonLiberiaLithuaniaMalaysiaMexicoMicronesiaMiddle AfricaMoldovaMoroccoNepalNetherlandsNicaraguaNigeriaNorth AmericaNorth MacedoniaNorthern AfricaNorthern EuropeNorwayOceaniaPakistanPanamaPeruPhilippinesPolandPortugalRomaniaRussiaSaudi ArabiaScotlandSenegalSerbiaSierra LeoneSingaporeSouth AfricaSouth AmericaSouth Central AsiaSouth Eastern AsiaSouthern EuropeSpainSri LankaSt. Vincent and the GrenadinesSudanSwedenSwitzerlandSyriaTaiwanThailandTrinidad and TobagoTurkeyUgandaUkraineUruguayUzbekistanVenezuelaVietnamWest IndiesWestern AfricaWestern AsiaWestern EuropeYemenZaireZimbabweAzores
In Labor Force | Age 30-34
Income
Poverty
Unemployment
Labor Participation
Family Structure
Vehicle Availability
Education Level
Disability

In Labor Force | Age 30-34 Comparison

Immigrants from Somalia

Somalis

Exceptional
Exceptional
86.2%
IN LABOR FORCE | AGE 30-34
100.0/ 100
METRIC RATING
9th/ 347
METRIC RANK
86.2%
IN LABOR FORCE | AGE 30-34
100.0/ 100
METRIC RATING
6th/ 347
METRIC RANK

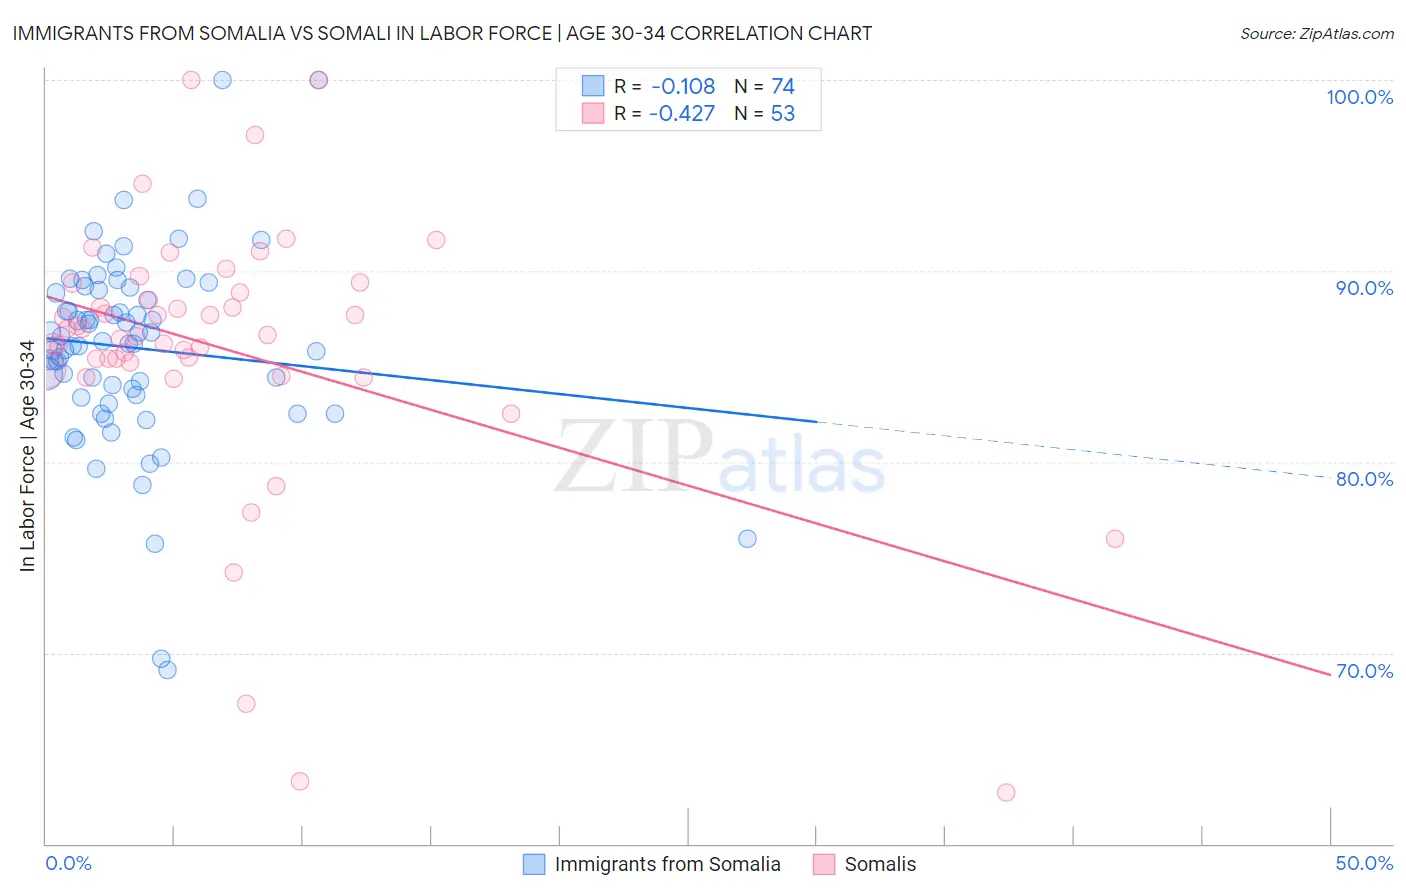
Immigrants from Somalia vs Somali In Labor Force | Age 30-34 Correlation Chart

The statistical analysis conducted on geographies consisting of 92,106,685 people shows a poor negative correlation between the proportion of Immigrants from Somalia and labor force participation rate among population between the ages 30 and 34 in the United States with a correlation coefficient (R) of -0.108 and weighted average of 86.2%. Similarly, the statistical analysis conducted on geographies consisting of 99,305,545 people shows a moderate negative correlation between the proportion of Somalis and labor force participation rate among population between the ages 30 and 34 in the United States with a correlation coefficient (R) of -0.427 and weighted average of 86.2%, a difference of 0.040%.
Immigrants from Somalia vs Somali In Labor Force | Age 30-34

In Labor Force | Age 30-34 Correlation Summary

MeasurementImmigrants from SomaliaSomali
Minimum69.1%62.7%
Maximum100.0%100.0%
Range30.9%37.3%
Mean86.0%85.9%
Median86.3%86.6%
Interquartile 25% (IQ1)83.5%85.0%
Interquartile 75% (IQ3)89.0%89.1%
Interquartile Range (IQR)5.5%4.1%
Standard Deviation (Sample)5.1%7.1%
Standard Deviation (Population)5.1%7.0%

Demographics Similar to Immigrants from Somalia and Somalis by In Labor Force | Age 30-34

In terms of in labor force | age 30-34, the demographic groups most similar to Immigrants from Somalia are Cambodian (86.2%, a difference of 0.010%), Immigrants from Bolivia (86.2%, a difference of 0.020%), Immigrants from Serbia (86.2%, a difference of 0.040%), Carpatho Rusyn (86.2%, a difference of 0.040%), and Immigrants from Ireland (86.3%, a difference of 0.070%). Similarly, the demographic groups most similar to Somalis are Immigrants from Bolivia (86.2%, a difference of 0.010%), Cambodian (86.2%, a difference of 0.020%), Immigrants from Ireland (86.3%, a difference of 0.030%), Immigrants from Serbia (86.2%, a difference of 0.070%), and Carpatho Rusyn (86.2%, a difference of 0.080%).
DemographicsRating | RankIn Labor Force | Age 30-34
Luxembourgers
100.0
/100
|
#1
Exceptional
86.6%
Ethiopians
100.0
/100
|
#2
Exceptional
86.6%
Immigrants | Ethiopia
100.0
/100
|
#3
Exceptional
86.6%
Liberians
100.0
/100
|
#4
Exceptional
86.4%
Immigrants | Ireland
100.0
/100
|
#5
Exceptional
86.3%
Somalis
100.0
/100
|
#6
Exceptional
86.2%
Immigrants | Bolivia
100.0
/100
|
#7
Exceptional
86.2%
Cambodians
100.0
/100
|
#8
Exceptional
86.2%
Immigrants | Somalia
100.0
/100
|
#9
Exceptional
86.2%
Immigrants | Serbia
100.0
/100
|
#10
Exceptional
86.2%
Carpatho Rusyns
100.0
/100
|
#11
Exceptional
86.2%
Bolivians
100.0
/100
|
#12
Exceptional
86.1%
Immigrants | Croatia
100.0
/100
|
#13
Exceptional
86.1%
Immigrants | Cabo Verde
100.0
/100
|
#14
Exceptional
86.1%
Immigrants | Albania
100.0
/100
|
#15
Exceptional
86.1%
Latvians
100.0
/100
|
#16
Exceptional
86.0%
Immigrants | Cameroon
100.0
/100
|
#17
Exceptional
86.0%
Immigrants | Sierra Leone
100.0
/100
|
#18
Exceptional
86.0%
Sierra Leoneans
100.0
/100
|
#19
Exceptional
86.0%
Bulgarians
100.0
/100
|
#20
Exceptional
86.0%