Immigrants from Sierra Leone vs Immigrants from Denmark In Labor Force | Age 20-24
COMPARE
Immigrants from Sierra Leone
Immigrants from Denmark
In Labor Force | Age 20-24
In Labor Force | Age 20-24 Comparison
Immigrants from Sierra Leone
Immigrants from Denmark
75.8%
IN LABOR FORCE | AGE 20-24
93.8/ 100
METRIC RATING
124th/ 347
METRIC RANK
74.8%
IN LABOR FORCE | AGE 20-24
25.8/ 100
METRIC RATING
194th/ 347
METRIC RANK
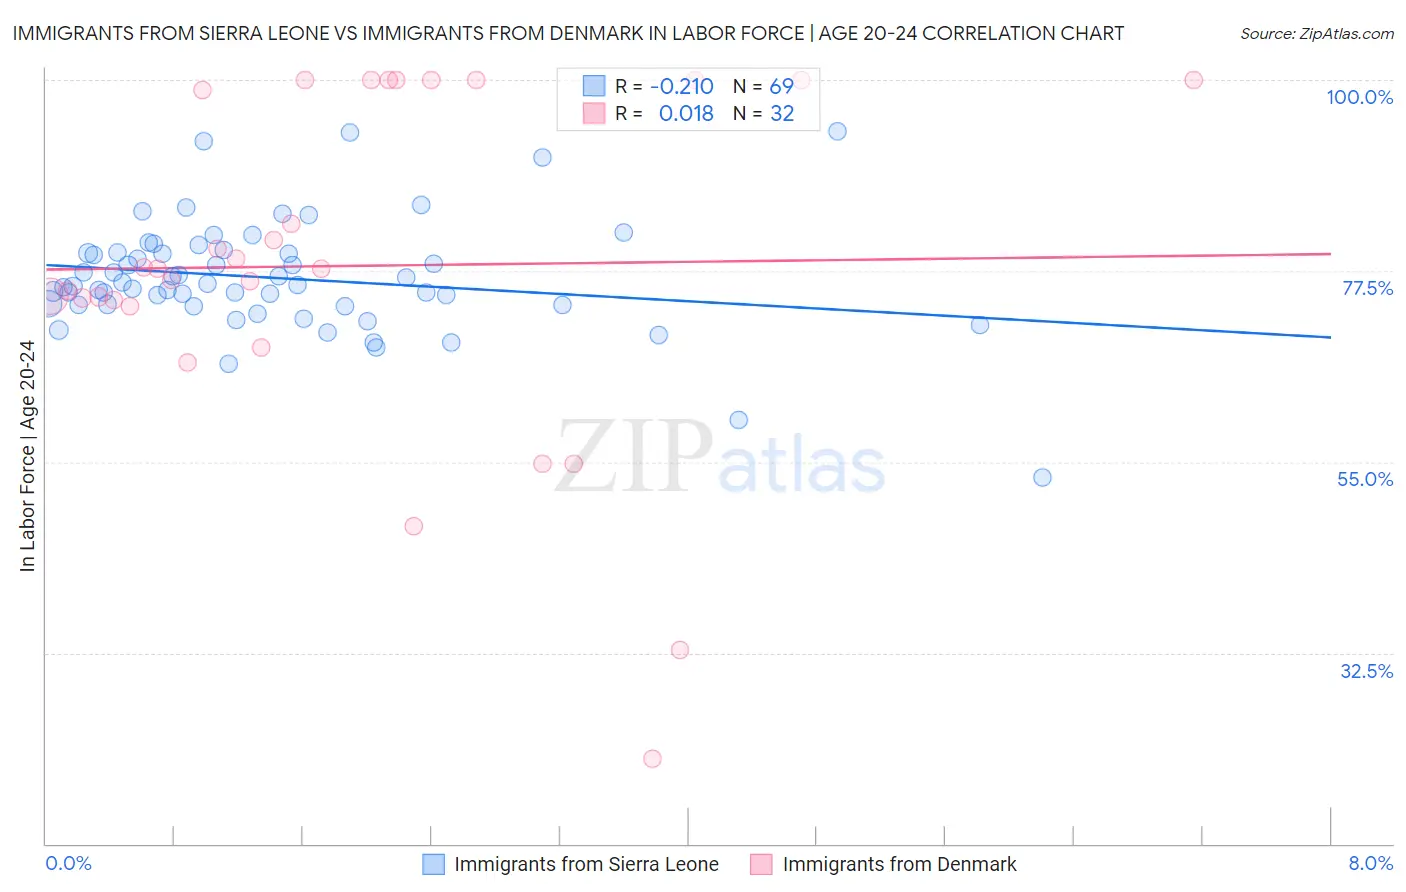
Immigrants from Sierra Leone vs Immigrants from Denmark In Labor Force | Age 20-24 Correlation Chart
The statistical analysis conducted on geographies consisting of 101,648,861 people shows a weak negative correlation between the proportion of Immigrants from Sierra Leone and labor force participation rate among population between the ages 20 and 24 in the United States with a correlation coefficient (R) of -0.210 and weighted average of 75.8%. Similarly, the statistical analysis conducted on geographies consisting of 136,401,284 people shows no correlation between the proportion of Immigrants from Denmark and labor force participation rate among population between the ages 20 and 24 in the United States with a correlation coefficient (R) of 0.018 and weighted average of 74.8%, a difference of 1.4%.
In Labor Force | Age 20-24 Correlation Summary
| Measurement | Immigrants from Sierra Leone | Immigrants from Denmark |
| Minimum | 53.1% | 20.0% |
| Maximum | 93.9% | 100.0% |
| Range | 40.8% | 80.0% |
| Mean | 76.7% | 78.1% |
| Median | 75.9% | 77.7% |
| Interquartile 25% (IQ1) | 73.5% | 73.7% |
| Interquartile 75% (IQ3) | 79.6% | 100.0% |
| Interquartile Range (IQR) | 6.1% | 26.3% |
| Standard Deviation (Sample) | 6.7% | 20.1% |
| Standard Deviation (Population) | 6.6% | 19.8% |
Similar Demographics by In Labor Force | Age 20-24
Demographics Similar to Immigrants from Sierra Leone by In Labor Force | Age 20-24
In terms of in labor force | age 20-24, the demographic groups most similar to Immigrants from Sierra Leone are Immigrants from Scotland (75.8%, a difference of 0.010%), Pakistani (75.8%, a difference of 0.020%), Immigrants from Bulgaria (75.8%, a difference of 0.020%), Immigrants from Serbia (75.8%, a difference of 0.030%), and Immigrants from Africa (75.8%, a difference of 0.050%).
| Demographics | Rating | Rank | In Labor Force | Age 20-24 |
| Assyrians/Chaldeans/Syriacs | 94.9 /100 | #117 | Exceptional 75.9% |
| Spanish Americans | 94.8 /100 | #118 | Exceptional 75.8% |
| Immigrants | Portugal | 94.8 /100 | #119 | Exceptional 75.8% |
| Immigrants | Africa | 94.6 /100 | #120 | Exceptional 75.8% |
| Immigrants | Serbia | 94.3 /100 | #121 | Exceptional 75.8% |
| Pakistanis | 94.1 /100 | #122 | Exceptional 75.8% |
| Immigrants | Bulgaria | 94.1 /100 | #123 | Exceptional 75.8% |
| Immigrants | Sierra Leone | 93.8 /100 | #124 | Exceptional 75.8% |
| Immigrants | Scotland | 93.7 /100 | #125 | Exceptional 75.8% |
| Brazilians | 93.0 /100 | #126 | Exceptional 75.8% |
| Sub-Saharan Africans | 90.9 /100 | #127 | Exceptional 75.7% |
| Immigrants | Afghanistan | 89.4 /100 | #128 | Excellent 75.6% |
| Iroquois | 89.1 /100 | #129 | Excellent 75.6% |
| Immigrants | Austria | 88.8 /100 | #130 | Excellent 75.6% |
| Immigrants | Jordan | 88.5 /100 | #131 | Excellent 75.6% |
Demographics Similar to Immigrants from Denmark by In Labor Force | Age 20-24
In terms of in labor force | age 20-24, the demographic groups most similar to Immigrants from Denmark are Eastern European (74.8%, a difference of 0.010%), Immigrants from Vietnam (74.7%, a difference of 0.010%), Panamanian (74.7%, a difference of 0.010%), Immigrants from Europe (74.8%, a difference of 0.030%), and Alsatian (74.8%, a difference of 0.030%).
| Demographics | Rating | Rank | In Labor Force | Age 20-24 |
| Immigrants | Honduras | 33.5 /100 | #187 | Fair 74.9% |
| Hondurans | 32.7 /100 | #188 | Fair 74.8% |
| Immigrants | Northern Europe | 32.6 /100 | #189 | Fair 74.8% |
| Russians | 32.2 /100 | #190 | Fair 74.8% |
| Senegalese | 28.1 /100 | #191 | Fair 74.8% |
| Immigrants | Europe | 27.5 /100 | #192 | Fair 74.8% |
| Alsatians | 27.1 /100 | #193 | Fair 74.8% |
| Immigrants | Denmark | 25.8 /100 | #194 | Fair 74.8% |
| Eastern Europeans | 25.4 /100 | #195 | Fair 74.8% |
| Immigrants | Vietnam | 25.1 /100 | #196 | Fair 74.7% |
| Panamanians | 25.0 /100 | #197 | Fair 74.7% |
| Immigrants | Nigeria | 24.2 /100 | #198 | Fair 74.7% |
| Taiwanese | 23.2 /100 | #199 | Fair 74.7% |
| Nigerians | 21.9 /100 | #200 | Fair 74.7% |
| Choctaw | 21.4 /100 | #201 | Fair 74.7% |