Immigrants from Sierra Leone vs Immigrants from Argentina In Labor Force | Age > 16
COMPARE
Immigrants from Sierra Leone
Immigrants from Argentina
In Labor Force | Age > 16
In Labor Force | Age > 16 Comparison
Immigrants from Sierra Leone
Immigrants from Argentina
68.5%
IN LABOR FORCE | AGE > 16
100.0/ 100
METRIC RATING
8th/ 347
METRIC RANK
65.6%
IN LABOR FORCE | AGE > 16
92.4/ 100
METRIC RATING
136th/ 347
METRIC RANK
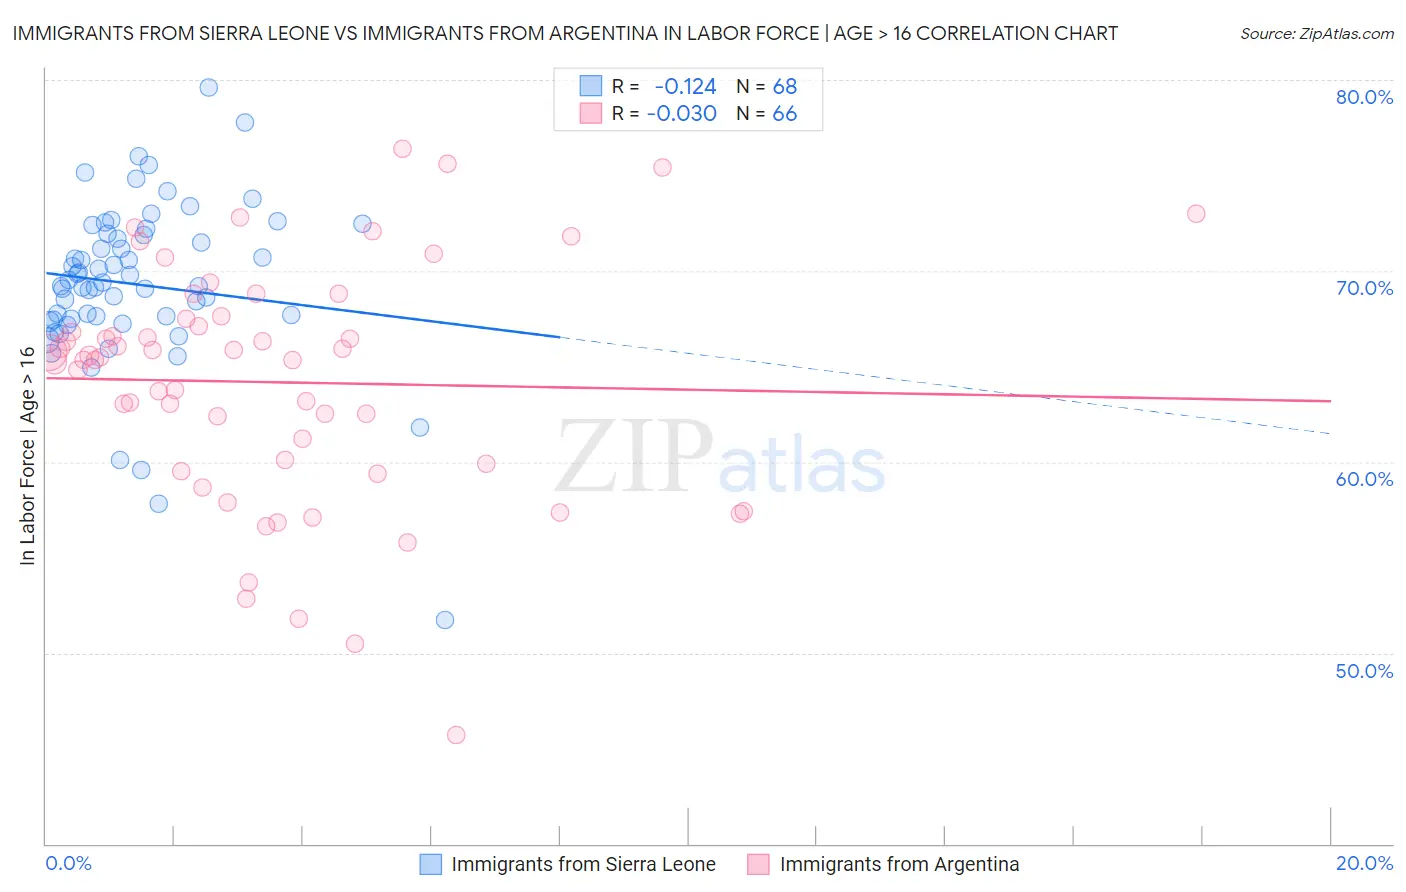
Immigrants from Sierra Leone vs Immigrants from Argentina In Labor Force | Age > 16 Correlation Chart
The statistical analysis conducted on geographies consisting of 101,649,709 people shows a poor negative correlation between the proportion of Immigrants from Sierra Leone and labor force participation rate among population ages 16 and over in the United States with a correlation coefficient (R) of -0.124 and weighted average of 68.5%. Similarly, the statistical analysis conducted on geographies consisting of 264,438,134 people shows no correlation between the proportion of Immigrants from Argentina and labor force participation rate among population ages 16 and over in the United States with a correlation coefficient (R) of -0.030 and weighted average of 65.6%, a difference of 4.4%.
In Labor Force | Age > 16 Correlation Summary
| Measurement | Immigrants from Sierra Leone | Immigrants from Argentina |
| Minimum | 51.7% | 45.7% |
| Maximum | 79.6% | 76.4% |
| Range | 27.9% | 30.7% |
| Mean | 69.3% | 64.2% |
| Median | 69.3% | 65.4% |
| Interquartile 25% (IQ1) | 67.5% | 59.9% |
| Interquartile 75% (IQ3) | 71.9% | 67.5% |
| Interquartile Range (IQR) | 4.5% | 7.6% |
| Standard Deviation (Sample) | 4.4% | 6.3% |
| Standard Deviation (Population) | 4.4% | 6.2% |
Similar Demographics by In Labor Force | Age > 16
Demographics Similar to Immigrants from Sierra Leone by In Labor Force | Age > 16
In terms of in labor force | age > 16, the demographic groups most similar to Immigrants from Sierra Leone are Immigrants from Eastern Africa (68.5%, a difference of 0.010%), Immigrants from Bolivia (68.4%, a difference of 0.050%), Immigrants from Cameroon (68.7%, a difference of 0.32%), Bolivian (68.2%, a difference of 0.41%), and Immigrants from Eritrea (68.9%, a difference of 0.57%).
| Demographics | Rating | Rank | In Labor Force | Age > 16 |
| Immigrants | Ethiopia | 100.0 /100 | #1 | Exceptional 69.4% |
| Ethiopians | 100.0 /100 | #2 | Exceptional 69.3% |
| Somalis | 100.0 /100 | #3 | Exceptional 69.2% |
| Immigrants | Somalia | 100.0 /100 | #4 | Exceptional 69.1% |
| Sierra Leoneans | 100.0 /100 | #5 | Exceptional 68.9% |
| Immigrants | Eritrea | 100.0 /100 | #6 | Exceptional 68.9% |
| Immigrants | Cameroon | 100.0 /100 | #7 | Exceptional 68.7% |
| Immigrants | Sierra Leone | 100.0 /100 | #8 | Exceptional 68.5% |
| Immigrants | Eastern Africa | 100.0 /100 | #9 | Exceptional 68.5% |
| Immigrants | Bolivia | 100.0 /100 | #10 | Exceptional 68.4% |
| Bolivians | 100.0 /100 | #11 | Exceptional 68.2% |
| Sudanese | 100.0 /100 | #12 | Exceptional 68.0% |
| Immigrants | Nepal | 100.0 /100 | #13 | Exceptional 68.0% |
| Liberians | 100.0 /100 | #14 | Exceptional 67.8% |
| Immigrants | Middle Africa | 100.0 /100 | #15 | Exceptional 67.7% |
Demographics Similar to Immigrants from Argentina by In Labor Force | Age > 16
In terms of in labor force | age > 16, the demographic groups most similar to Immigrants from Argentina are Guatemalan (65.6%, a difference of 0.0%), Guamanian/Chamorro (65.6%, a difference of 0.0%), Immigrants from West Indies (65.6%, a difference of 0.020%), Costa Rican (65.6%, a difference of 0.030%), and Immigrants from Lithuania (65.6%, a difference of 0.040%).
| Demographics | Rating | Rank | In Labor Force | Age > 16 |
| Immigrants | Philippines | 94.5 /100 | #129 | Exceptional 65.6% |
| Immigrants | Guatemala | 94.4 /100 | #130 | Exceptional 65.6% |
| Icelanders | 94.3 /100 | #131 | Exceptional 65.6% |
| Immigrants | North Macedonia | 94.1 /100 | #132 | Exceptional 65.6% |
| Immigrants | Lithuania | 93.5 /100 | #133 | Exceptional 65.6% |
| Costa Ricans | 93.2 /100 | #134 | Exceptional 65.6% |
| Guatemalans | 92.5 /100 | #135 | Exceptional 65.6% |
| Immigrants | Argentina | 92.4 /100 | #136 | Exceptional 65.6% |
| Guamanians/Chamorros | 92.4 /100 | #137 | Exceptional 65.6% |
| Immigrants | West Indies | 92.0 /100 | #138 | Exceptional 65.6% |
| Immigrants | Taiwan | 90.8 /100 | #139 | Exceptional 65.5% |
| Immigrants | Costa Rica | 90.8 /100 | #140 | Exceptional 65.5% |
| Samoans | 90.5 /100 | #141 | Exceptional 65.5% |
| Indians (Asian) | 89.5 /100 | #142 | Excellent 65.5% |
| Latvians | 89.4 /100 | #143 | Excellent 65.5% |