Immigrants from Serbia vs Osage In Labor Force | Age > 16
COMPARE
Immigrants from Serbia
Osage
In Labor Force | Age > 16
In Labor Force | Age > 16 Comparison
Immigrants from Serbia
Osage
65.8%
IN LABOR FORCE | AGE > 16
98.1/ 100
METRIC RATING
106th/ 347
METRIC RANK
63.5%
IN LABOR FORCE | AGE > 16
0.0/ 100
METRIC RATING
305th/ 347
METRIC RANK
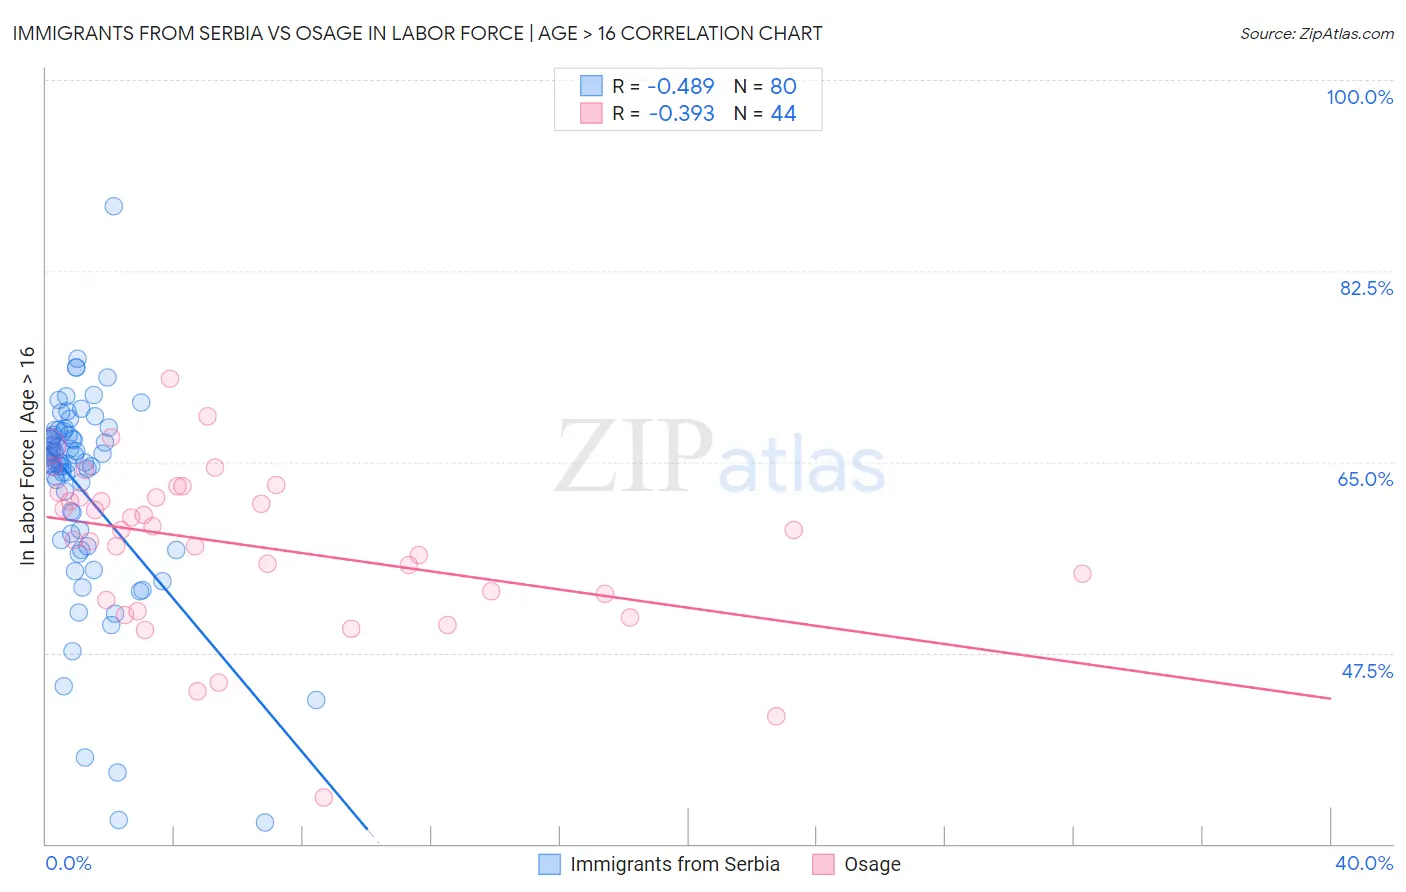
Immigrants from Serbia vs Osage In Labor Force | Age > 16 Correlation Chart
The statistical analysis conducted on geographies consisting of 131,746,975 people shows a moderate negative correlation between the proportion of Immigrants from Serbia and labor force participation rate among population ages 16 and over in the United States with a correlation coefficient (R) of -0.489 and weighted average of 65.8%. Similarly, the statistical analysis conducted on geographies consisting of 91,805,602 people shows a mild negative correlation between the proportion of Osage and labor force participation rate among population ages 16 and over in the United States with a correlation coefficient (R) of -0.393 and weighted average of 63.5%, a difference of 3.7%.
In Labor Force | Age > 16 Correlation Summary
| Measurement | Immigrants from Serbia | Osage |
| Minimum | 31.9% | 34.2% |
| Maximum | 88.4% | 72.7% |
| Range | 56.5% | 38.5% |
| Mean | 62.3% | 57.3% |
| Median | 64.9% | 58.8% |
| Interquartile 25% (IQ1) | 57.5% | 52.6% |
| Interquartile 75% (IQ3) | 67.5% | 62.0% |
| Interquartile Range (IQR) | 9.9% | 9.4% |
| Standard Deviation (Sample) | 9.6% | 7.5% |
| Standard Deviation (Population) | 9.5% | 7.4% |
Similar Demographics by In Labor Force | Age > 16
Demographics Similar to Immigrants from Serbia by In Labor Force | Age > 16
In terms of in labor force | age > 16, the demographic groups most similar to Immigrants from Serbia are Immigrants from Poland (65.8%, a difference of 0.0%), Immigrants from Spain (65.8%, a difference of 0.020%), Immigrants from Japan (65.8%, a difference of 0.020%), Colombian (65.9%, a difference of 0.040%), and Palestinian (65.9%, a difference of 0.050%).
| Demographics | Rating | Rank | In Labor Force | Age > 16 |
| Immigrants | Australia | 98.7 /100 | #99 | Exceptional 65.9% |
| Okinawans | 98.7 /100 | #100 | Exceptional 65.9% |
| Immigrants | Colombia | 98.6 /100 | #101 | Exceptional 65.9% |
| Uruguayans | 98.6 /100 | #102 | Exceptional 65.9% |
| Immigrants | South Eastern Asia | 98.5 /100 | #103 | Exceptional 65.9% |
| Palestinians | 98.5 /100 | #104 | Exceptional 65.9% |
| Colombians | 98.4 /100 | #105 | Exceptional 65.9% |
| Immigrants | Serbia | 98.1 /100 | #106 | Exceptional 65.8% |
| Immigrants | Poland | 98.1 /100 | #107 | Exceptional 65.8% |
| Immigrants | Spain | 98.0 /100 | #108 | Exceptional 65.8% |
| Immigrants | Japan | 98.0 /100 | #109 | Exceptional 65.8% |
| Japanese | 97.7 /100 | #110 | Exceptional 65.8% |
| Immigrants | Honduras | 97.5 /100 | #111 | Exceptional 65.8% |
| Laotians | 97.4 /100 | #112 | Exceptional 65.8% |
| Pakistanis | 97.1 /100 | #113 | Exceptional 65.8% |
Demographics Similar to Osage by In Labor Force | Age > 16
In terms of in labor force | age > 16, the demographic groups most similar to Osage are Nonimmigrants (63.5%, a difference of 0.050%), Black/African American (63.4%, a difference of 0.090%), Cree (63.5%, a difference of 0.10%), Central American Indian (63.4%, a difference of 0.13%), and Delaware (63.6%, a difference of 0.14%).
| Demographics | Rating | Rank | In Labor Force | Age > 16 |
| Comanche | 0.0 /100 | #298 | Tragic 63.6% |
| Whites/Caucasians | 0.0 /100 | #299 | Tragic 63.6% |
| Immigrants | Azores | 0.0 /100 | #300 | Tragic 63.6% |
| Spanish Americans | 0.0 /100 | #301 | Tragic 63.6% |
| Delaware | 0.0 /100 | #302 | Tragic 63.6% |
| Cree | 0.0 /100 | #303 | Tragic 63.5% |
| Immigrants | Nonimmigrants | 0.0 /100 | #304 | Tragic 63.5% |
| Osage | 0.0 /100 | #305 | Tragic 63.5% |
| Blacks/African Americans | 0.0 /100 | #306 | Tragic 63.4% |
| Central American Indians | 0.0 /100 | #307 | Tragic 63.4% |
| Pennsylvania Germans | 0.0 /100 | #308 | Tragic 63.4% |
| Scotch-Irish | 0.0 /100 | #309 | Tragic 63.3% |
| Shoshone | 0.0 /100 | #310 | Tragic 63.2% |
| Blackfeet | 0.0 /100 | #311 | Tragic 63.2% |
| Iroquois | 0.0 /100 | #312 | Tragic 63.2% |