Immigrants from Senegal vs Immigrants from Albania In Labor Force | Age > 16
COMPARE
Immigrants from Senegal
Immigrants from Albania
In Labor Force | Age > 16
In Labor Force | Age > 16 Comparison
Immigrants from Senegal
Immigrants from Albania
66.4%
IN LABOR FORCE | AGE > 16
99.9/ 100
METRIC RATING
56th/ 347
METRIC RANK
65.4%
IN LABOR FORCE | AGE > 16
85.7/ 100
METRIC RATING
149th/ 347
METRIC RANK
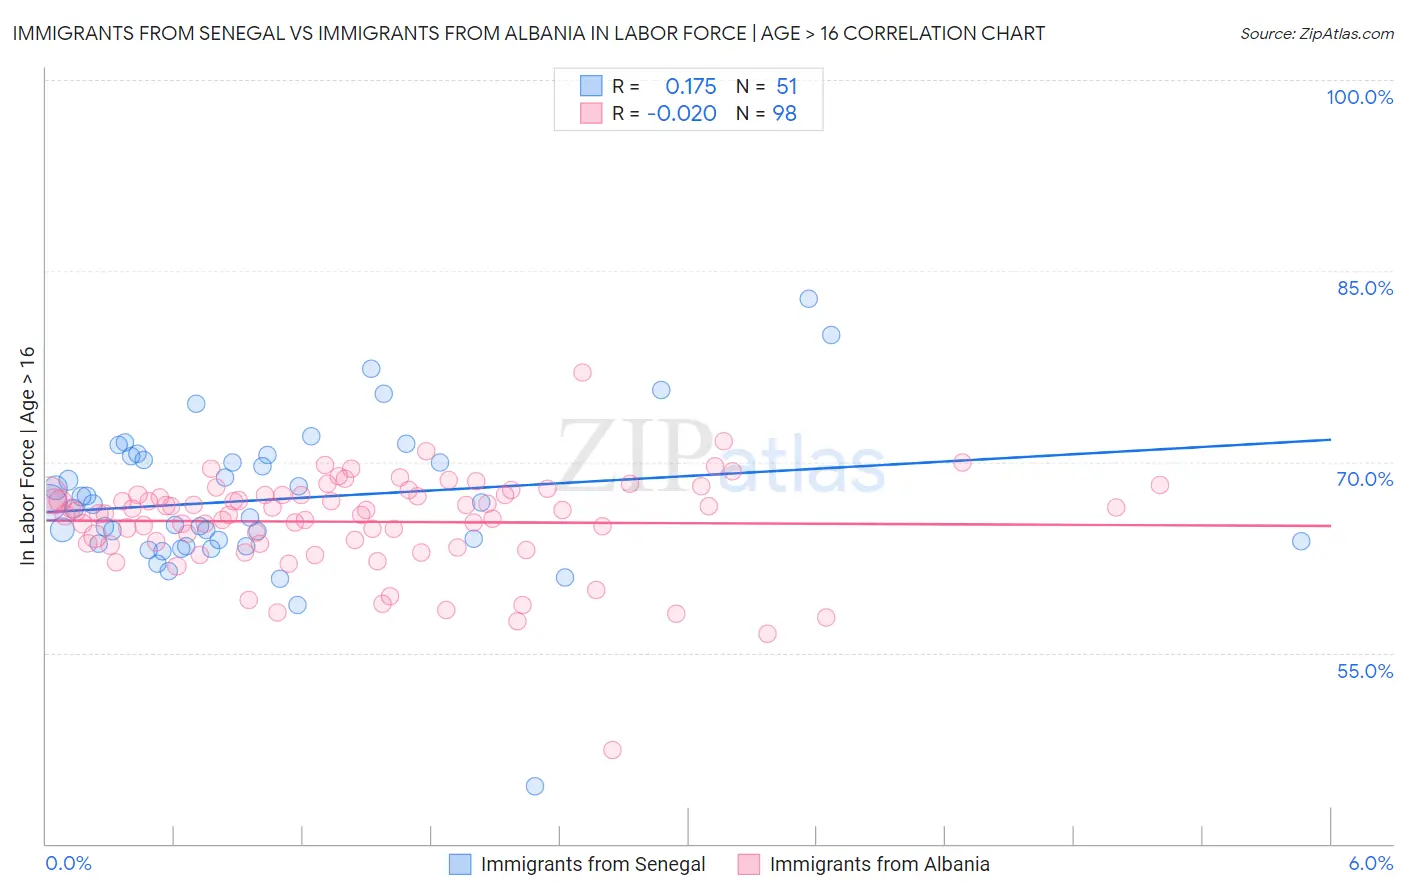
Immigrants from Senegal vs Immigrants from Albania In Labor Force | Age > 16 Correlation Chart
The statistical analysis conducted on geographies consisting of 90,129,295 people shows a poor positive correlation between the proportion of Immigrants from Senegal and labor force participation rate among population ages 16 and over in the United States with a correlation coefficient (R) of 0.175 and weighted average of 66.4%. Similarly, the statistical analysis conducted on geographies consisting of 119,399,287 people shows no correlation between the proportion of Immigrants from Albania and labor force participation rate among population ages 16 and over in the United States with a correlation coefficient (R) of -0.020 and weighted average of 65.4%, a difference of 1.5%.
In Labor Force | Age > 16 Correlation Summary
| Measurement | Immigrants from Senegal | Immigrants from Albania |
| Minimum | 44.5% | 47.4% |
| Maximum | 82.8% | 77.0% |
| Range | 38.3% | 29.6% |
| Mean | 67.1% | 65.3% |
| Median | 66.7% | 66.2% |
| Interquartile 25% (IQ1) | 63.6% | 63.6% |
| Interquartile 75% (IQ3) | 70.4% | 67.4% |
| Interquartile Range (IQR) | 6.9% | 3.8% |
| Standard Deviation (Sample) | 5.9% | 3.9% |
| Standard Deviation (Population) | 5.9% | 3.9% |
Similar Demographics by In Labor Force | Age > 16
Demographics Similar to Immigrants from Senegal by In Labor Force | Age > 16
In terms of in labor force | age > 16, the demographic groups most similar to Immigrants from Senegal are Bulgarian (66.4%, a difference of 0.010%), Immigrants from Venezuela (66.4%, a difference of 0.030%), Immigrants from Bosnia and Herzegovina (66.5%, a difference of 0.080%), Immigrants from Sri Lanka (66.5%, a difference of 0.11%), and Immigrants from Saudi Arabia (66.3%, a difference of 0.11%).
| Demographics | Rating | Rank | In Labor Force | Age > 16 |
| Immigrants | Northern Africa | 100.0 /100 | #49 | Exceptional 66.6% |
| Cape Verdeans | 100.0 /100 | #50 | Exceptional 66.6% |
| Immigrants | Kuwait | 100.0 /100 | #51 | Exceptional 66.5% |
| Paraguayans | 99.9 /100 | #52 | Exceptional 66.5% |
| Immigrants | Sri Lanka | 99.9 /100 | #53 | Exceptional 66.5% |
| Immigrants | Bosnia and Herzegovina | 99.9 /100 | #54 | Exceptional 66.5% |
| Immigrants | Venezuela | 99.9 /100 | #55 | Exceptional 66.4% |
| Immigrants | Senegal | 99.9 /100 | #56 | Exceptional 66.4% |
| Bulgarians | 99.9 /100 | #57 | Exceptional 66.4% |
| Immigrants | Saudi Arabia | 99.9 /100 | #58 | Exceptional 66.3% |
| Immigrants | Turkey | 99.9 /100 | #59 | Exceptional 66.3% |
| Immigrants | Peru | 99.8 /100 | #60 | Exceptional 66.3% |
| Immigrants | Burma/Myanmar | 99.8 /100 | #61 | Exceptional 66.3% |
| Indonesians | 99.8 /100 | #62 | Exceptional 66.3% |
| Venezuelans | 99.8 /100 | #63 | Exceptional 66.3% |
Demographics Similar to Immigrants from Albania by In Labor Force | Age > 16
In terms of in labor force | age > 16, the demographic groups most similar to Immigrants from Albania are Bhutanese (65.5%, a difference of 0.010%), Immigrants from Oceania (65.5%, a difference of 0.040%), Cypriot (65.5%, a difference of 0.060%), Immigrants from Romania (65.5%, a difference of 0.070%), and Tlingit-Haida (65.5%, a difference of 0.070%).
| Demographics | Rating | Rank | In Labor Force | Age > 16 |
| Indians (Asian) | 89.5 /100 | #142 | Excellent 65.5% |
| Latvians | 89.4 /100 | #143 | Excellent 65.5% |
| Immigrants | Romania | 88.6 /100 | #144 | Excellent 65.5% |
| Tlingit-Haida | 88.3 /100 | #145 | Excellent 65.5% |
| Cypriots | 88.2 /100 | #146 | Excellent 65.5% |
| Immigrants | Oceania | 87.5 /100 | #147 | Excellent 65.5% |
| Bhutanese | 86.3 /100 | #148 | Excellent 65.5% |
| Immigrants | Albania | 85.7 /100 | #149 | Excellent 65.4% |
| Immigrants | Immigrants | 81.9 /100 | #150 | Excellent 65.4% |
| Czechs | 81.5 /100 | #151 | Excellent 65.4% |
| Yugoslavians | 81.3 /100 | #152 | Excellent 65.4% |
| Immigrants | China | 80.5 /100 | #153 | Excellent 65.4% |
| Immigrants | Eastern Europe | 78.3 /100 | #154 | Good 65.4% |
| Immigrants | Armenia | 76.6 /100 | #155 | Good 65.3% |
| Immigrants | Ireland | 75.9 /100 | #156 | Good 65.3% |