Immigrants from Romania vs Immigrants from Chile In Labor Force | Age 45-54
COMPARE
Immigrants from Romania
Immigrants from Chile
In Labor Force | Age 45-54
In Labor Force | Age 45-54 Comparison
Immigrants from Romania
Immigrants from Chile
83.3%
IN LABOR FORCE | AGE 45-54
93.8/ 100
METRIC RATING
104th/ 347
METRIC RANK
83.2%
IN LABOR FORCE | AGE 45-54
91.6/ 100
METRIC RATING
115th/ 347
METRIC RANK
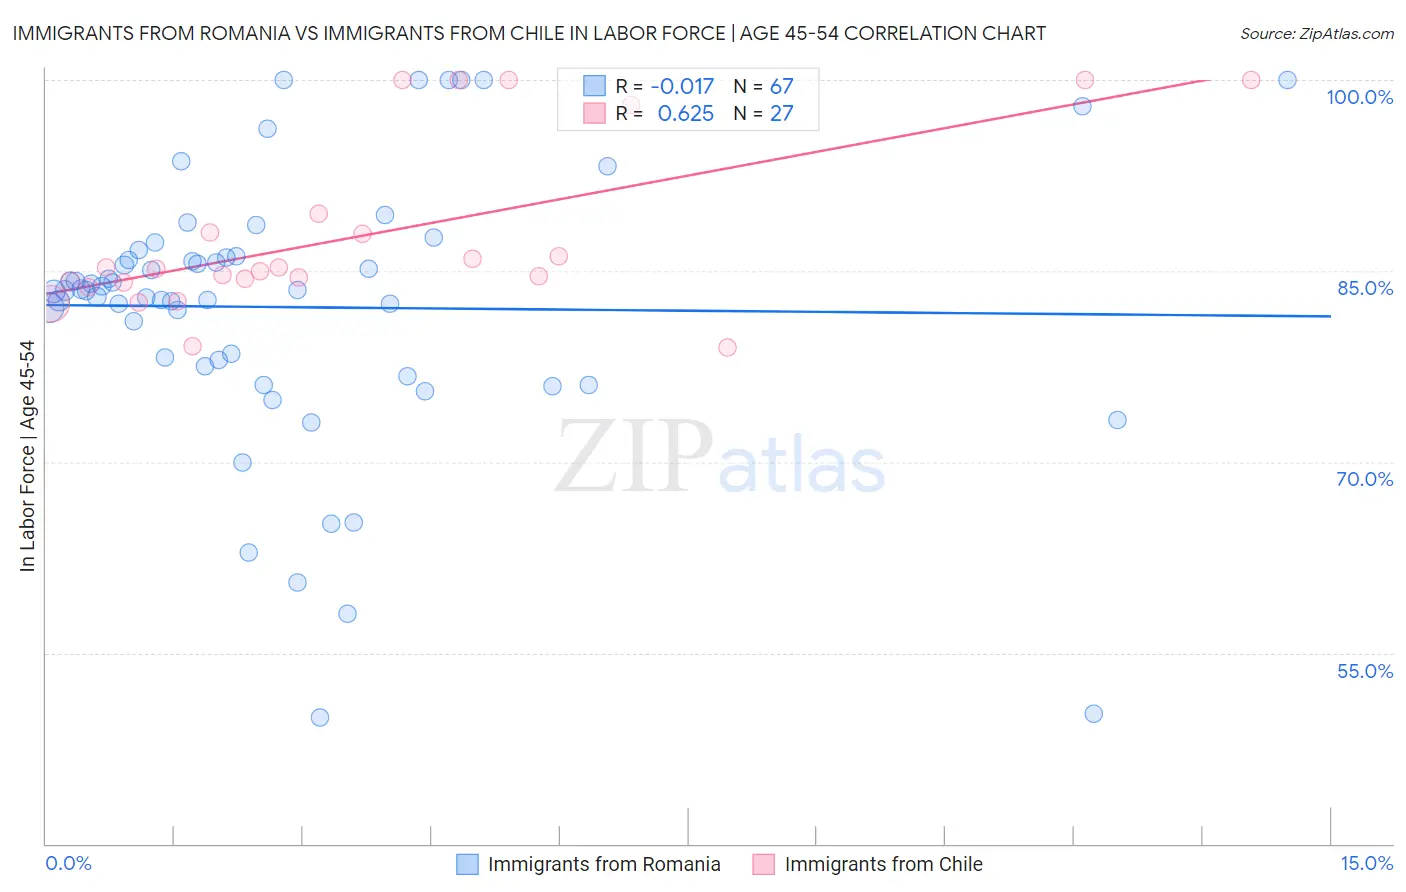
Immigrants from Romania vs Immigrants from Chile In Labor Force | Age 45-54 Correlation Chart
The statistical analysis conducted on geographies consisting of 256,955,875 people shows no correlation between the proportion of Immigrants from Romania and labor force participation rate among population between the ages 45 and 54 in the United States with a correlation coefficient (R) of -0.017 and weighted average of 83.3%. Similarly, the statistical analysis conducted on geographies consisting of 218,594,032 people shows a significant positive correlation between the proportion of Immigrants from Chile and labor force participation rate among population between the ages 45 and 54 in the United States with a correlation coefficient (R) of 0.625 and weighted average of 83.2%, a difference of 0.070%.
In Labor Force | Age 45-54 Correlation Summary
| Measurement | Immigrants from Romania | Immigrants from Chile |
| Minimum | 49.9% | 79.0% |
| Maximum | 100.0% | 100.0% |
| Range | 50.1% | 21.0% |
| Mean | 82.1% | 87.8% |
| Median | 83.5% | 85.1% |
| Interquartile 25% (IQ1) | 77.6% | 84.1% |
| Interquartile 75% (IQ3) | 86.2% | 89.5% |
| Interquartile Range (IQR) | 8.6% | 5.4% |
| Standard Deviation (Sample) | 10.8% | 6.8% |
| Standard Deviation (Population) | 10.7% | 6.7% |
Demographics Similar to Immigrants from Romania and Immigrants from Chile by In Labor Force | Age 45-54
In terms of in labor force | age 45-54, the demographic groups most similar to Immigrants from Romania are Immigrants from Singapore (83.3%, a difference of 0.0%), Albanian (83.3%, a difference of 0.0%), Mongolian (83.3%, a difference of 0.010%), Immigrants from Belarus (83.3%, a difference of 0.010%), and Immigrants from South America (83.2%, a difference of 0.010%). Similarly, the demographic groups most similar to Immigrants from Chile are Assyrian/Chaldean/Syriac (83.2%, a difference of 0.0%), Immigrants from Malaysia (83.2%, a difference of 0.0%), Immigrants from Albania (83.2%, a difference of 0.010%), Immigrants from Afghanistan (83.2%, a difference of 0.020%), and Immigrants from China (83.2%, a difference of 0.020%).
| Demographics | Rating | Rank | In Labor Force | Age 45-54 |
| Immigrants | Middle Africa | 94.3 /100 | #99 | Exceptional 83.3% |
| Mongolians | 94.2 /100 | #100 | Exceptional 83.3% |
| Immigrants | Belarus | 94.1 /100 | #101 | Exceptional 83.3% |
| Immigrants | Singapore | 93.9 /100 | #102 | Exceptional 83.3% |
| Albanians | 93.9 /100 | #103 | Exceptional 83.3% |
| Immigrants | Romania | 93.8 /100 | #104 | Exceptional 83.3% |
| Immigrants | South America | 93.5 /100 | #105 | Exceptional 83.2% |
| Sri Lankans | 93.2 /100 | #106 | Exceptional 83.2% |
| Iranians | 92.9 /100 | #107 | Exceptional 83.2% |
| Slovaks | 92.8 /100 | #108 | Exceptional 83.2% |
| Ukrainians | 92.7 /100 | #109 | Exceptional 83.2% |
| Immigrants | Africa | 92.6 /100 | #110 | Exceptional 83.2% |
| Immigrants | Italy | 92.5 /100 | #111 | Exceptional 83.2% |
| Immigrants | Afghanistan | 92.4 /100 | #112 | Exceptional 83.2% |
| Immigrants | Albania | 91.8 /100 | #113 | Exceptional 83.2% |
| Assyrians/Chaldeans/Syriacs | 91.7 /100 | #114 | Exceptional 83.2% |
| Immigrants | Chile | 91.6 /100 | #115 | Exceptional 83.2% |
| Immigrants | Malaysia | 91.4 /100 | #116 | Exceptional 83.2% |
| Immigrants | China | 90.9 /100 | #117 | Exceptional 83.2% |
| Immigrants | Europe | 90.7 /100 | #118 | Exceptional 83.2% |
| Immigrants | Uruguay | 90.2 /100 | #119 | Exceptional 83.2% |