Immigrants from Romania vs Costa Rican In Labor Force | Age 35-44

COMPARE

Immigrants from Romania
Race
Ancestry
AfghanAfricanAlaska NativeAlaskan AthabascanAlbanianAleutAlsatianAmericanApacheArabArapahoArgentineanArmenianAssyrian/Chaldean/SyriacAustralianAustrianBahamianBangladeshiBarbadianBasqueBelgianBelizeanBermudanBhutaneseBlackfeetBolivianBrazilianBritishBritish West IndianBulgarianBurmeseCajunCambodianCanadianCape VerdeanCarpatho RusynCelticCentral AmericanCentral American IndianCherokeeCheyenneChickasawChileanChineseChippewaChoctawColombianColvilleComancheCreeCreekCroatianCrowCubanCypriotCzechCzechoslovakianDanishDelawareDominicanDutchDutch West IndianEastern EuropeanEcuadorianEgyptianEnglishEstonianEthiopianEuropeanFijianFilipinoFinnishFrenchFrench American IndianFrench CanadianGermanGerman RussianGhanaianGreekGuamanian/ChamorroGuatemalanGuyaneseHaitianHmongHonduranHopiHoumaHungarianIcelanderIndian (Asian)IndonesianInupiatIranianIraqiIrishIroquoisIsraeliItalianJamaicanJapaneseJordanianKenyanKiowaKoreanLaotianLatvianLebaneseLiberianLithuanianLumbeeLuxembourgerMacedonianMalaysianMalteseMarshalleseMenomineeMexicanMexican American IndianMongolianMoroccanNative HawaiianNavajoNepaleseNew ZealanderNicaraguanNigerianNorthern EuropeanNorwegianOkinawanOsageOttawaPaiutePakistaniPalestinianPanamanianParaguayanPennsylvania GermanPeruvianPimaPolishPortuguesePotawatomiPuebloPuerto RicanPuget Sound SalishRomanianRussianSalvadoranSamoanScandinavianScotch-IrishScottishSeminoleSenegaleseSerbianShoshoneSierra LeoneanSiouxSlavicSlovakSloveneSomaliSouth AfricanSouth AmericanSouth American IndianSoviet UnionSpaniardSpanishSpanish AmericanSpanish American IndianSri LankanSubsaharan AfricanSudaneseSwedishSwissSyrianTaiwaneseThaiTlingit-HaidaTohono O'OdhamTonganTrinidadian and TobagonianTsimshianTurkishU.S. Virgin IslanderUgandanUkrainianUruguayanUteVenezuelanVietnameseWelshWest IndianYakamaYaquiYugoslavianYumanYup'ikZimbabwean
Immigration
NonimmigrantsImmigrantsAfghanistanAfricaAlbaniaArgentinaArmeniaAsiaAustraliaAustriaBahamasBangladeshBarbadosBelarusBelgiumBelizeBoliviaBosnia and HerzegovinaBrazilBulgariaBurma/MyanmarCabo VerdeCambodiaCameroonCanadaCaribbeanCentral AmericaChileChinaColombiaCongoCosta RicaCroatiaCubaCzechoslovakiaDenmarkDominicaDominican RepublicEastern AfricaEastern AsiaEastern EuropeEcuadorEgyptEl SalvadorEnglandEritreaEthiopiaEuropeFijiFranceGermanyGhanaGreeceGrenadaGuatemalaGuyanaHaitiHondurasHong KongHungaryIndiaIndonesiaIranIraqIrelandIsraelItalyJamaicaJapanJordanKazakhstanKenyaKoreaKuwaitLaosLatin AmericaLatviaLebanonLiberiaLithuaniaMalaysiaMexicoMicronesiaMiddle AfricaMoldovaMoroccoNepalNetherlandsNicaraguaNigeriaNorth AmericaNorth MacedoniaNorthern AfricaNorthern EuropeNorwayOceaniaPakistanPanamaPeruPhilippinesPolandPortugalRomaniaRussiaSaudi ArabiaScotlandSenegalSerbiaSierra LeoneSingaporeSomaliaSouth AfricaSouth AmericaSouth Central AsiaSouth Eastern AsiaSouthern EuropeSpainSri LankaSt. Vincent and the GrenadinesSudanSwedenSwitzerlandSyriaTaiwanThailandTrinidad and TobagoTurkeyUgandaUkraineUruguayUzbekistanVenezuelaVietnamWest IndiesWestern AfricaWestern AsiaWestern EuropeYemenZaireZimbabweAzores
Costa Rican
Race
Ancestry
AfghanAfricanAlaska NativeAlaskan AthabascanAlbanianAleutAlsatianAmericanApacheArabArapahoArgentineanArmenianAssyrian/Chaldean/SyriacAustralianAustrianBahamianBangladeshiBarbadianBasqueBelgianBelizeanBermudanBhutaneseBlackfeetBolivianBrazilianBritishBritish West IndianBulgarianBurmeseCajunCambodianCanadianCape VerdeanCarpatho RusynCelticCentral AmericanCentral American IndianCherokeeCheyenneChickasawChileanChineseChippewaChoctawColombianColvilleComancheCosta RicanCreeCreekCroatianCrowCubanCypriotCzechCzechoslovakianDanishDelawareDominicanDutchDutch West IndianEastern EuropeanEcuadorianEgyptianEnglishEstonianEthiopianEuropeanFijianFilipinoFinnishFrenchFrench American IndianFrench CanadianGermanGerman RussianGhanaianGreekGuamanian/ChamorroGuatemalanGuyaneseHaitianHmongHonduranHopiHoumaHungarianIcelanderIndian (Asian)IndonesianInupiatIranianIraqiIrishIroquoisIsraeliItalianJamaicanJapaneseJordanianKenyanKiowaKoreanLaotianLatvianLebaneseLiberianLithuanianLumbeeLuxembourgerMacedonianMalaysianMalteseMarshalleseMenomineeMexicanMexican American IndianMongolianMoroccanNative HawaiianNavajoNepaleseNew ZealanderNicaraguanNigerianNorthern EuropeanNorwegianOkinawanOsageOttawaPaiutePakistaniPalestinianPanamanianParaguayanPennsylvania GermanPeruvianPimaPolishPortuguesePotawatomiPuebloPuerto RicanPuget Sound SalishRomanianRussianSalvadoranSamoanScandinavianScotch-IrishScottishSeminoleSenegaleseSerbianShoshoneSierra LeoneanSiouxSlavicSlovakSloveneSomaliSouth AfricanSouth AmericanSouth American IndianSoviet UnionSpaniardSpanishSpanish AmericanSpanish American IndianSri LankanSubsaharan AfricanSudaneseSwedishSwissSyrianTaiwaneseThaiTlingit-HaidaTohono O'OdhamTonganTrinidadian and TobagonianTsimshianTurkishU.S. Virgin IslanderUgandanUkrainianUruguayanUteVenezuelanVietnameseWelshWest IndianYakamaYaquiYugoslavianYumanYup'ikZimbabwean
Immigration
NonimmigrantsImmigrantsAfghanistanAfricaAlbaniaArgentinaArmeniaAsiaAustraliaAustriaBahamasBangladeshBarbadosBelarusBelgiumBelizeBoliviaBosnia and HerzegovinaBrazilBulgariaBurma/MyanmarCabo VerdeCambodiaCameroonCanadaCaribbeanCentral AmericaChileChinaColombiaCongoCosta RicaCroatiaCubaCzechoslovakiaDenmarkDominicaDominican RepublicEastern AfricaEastern AsiaEastern EuropeEcuadorEgyptEl SalvadorEnglandEritreaEthiopiaEuropeFijiFranceGermanyGhanaGreeceGrenadaGuatemalaGuyanaHaitiHondurasHong KongHungaryIndiaIndonesiaIranIraqIrelandIsraelItalyJamaicaJapanJordanKazakhstanKenyaKoreaKuwaitLaosLatin AmericaLatviaLebanonLiberiaLithuaniaMalaysiaMexicoMicronesiaMiddle AfricaMoldovaMoroccoNepalNetherlandsNicaraguaNigeriaNorth AmericaNorth MacedoniaNorthern AfricaNorthern EuropeNorwayOceaniaPakistanPanamaPeruPhilippinesPolandPortugalRussiaSaudi ArabiaScotlandSenegalSerbiaSierra LeoneSingaporeSomaliaSouth AfricaSouth AmericaSouth Central AsiaSouth Eastern AsiaSouthern EuropeSpainSri LankaSt. Vincent and the GrenadinesSudanSwedenSwitzerlandSyriaTaiwanThailandTrinidad and TobagoTurkeyUgandaUkraineUruguayUzbekistanVenezuelaVietnamWest IndiesWestern AfricaWestern AsiaWestern EuropeYemenZaireZimbabweAzores
In Labor Force | Age 35-44
Income
Poverty
Unemployment
Labor Participation
Family Structure
Vehicle Availability
Education Level
Disability

In Labor Force | Age 35-44 Comparison

Immigrants from Romania

Costa Ricans

Exceptional
Fair
84.8%
IN LABOR FORCE | AGE 35-44
94.7/ 100
METRIC RATING
107th/ 347
METRIC RANK
84.3%
IN LABOR FORCE | AGE 35-44
35.3/ 100
METRIC RATING
185th/ 347
METRIC RANK

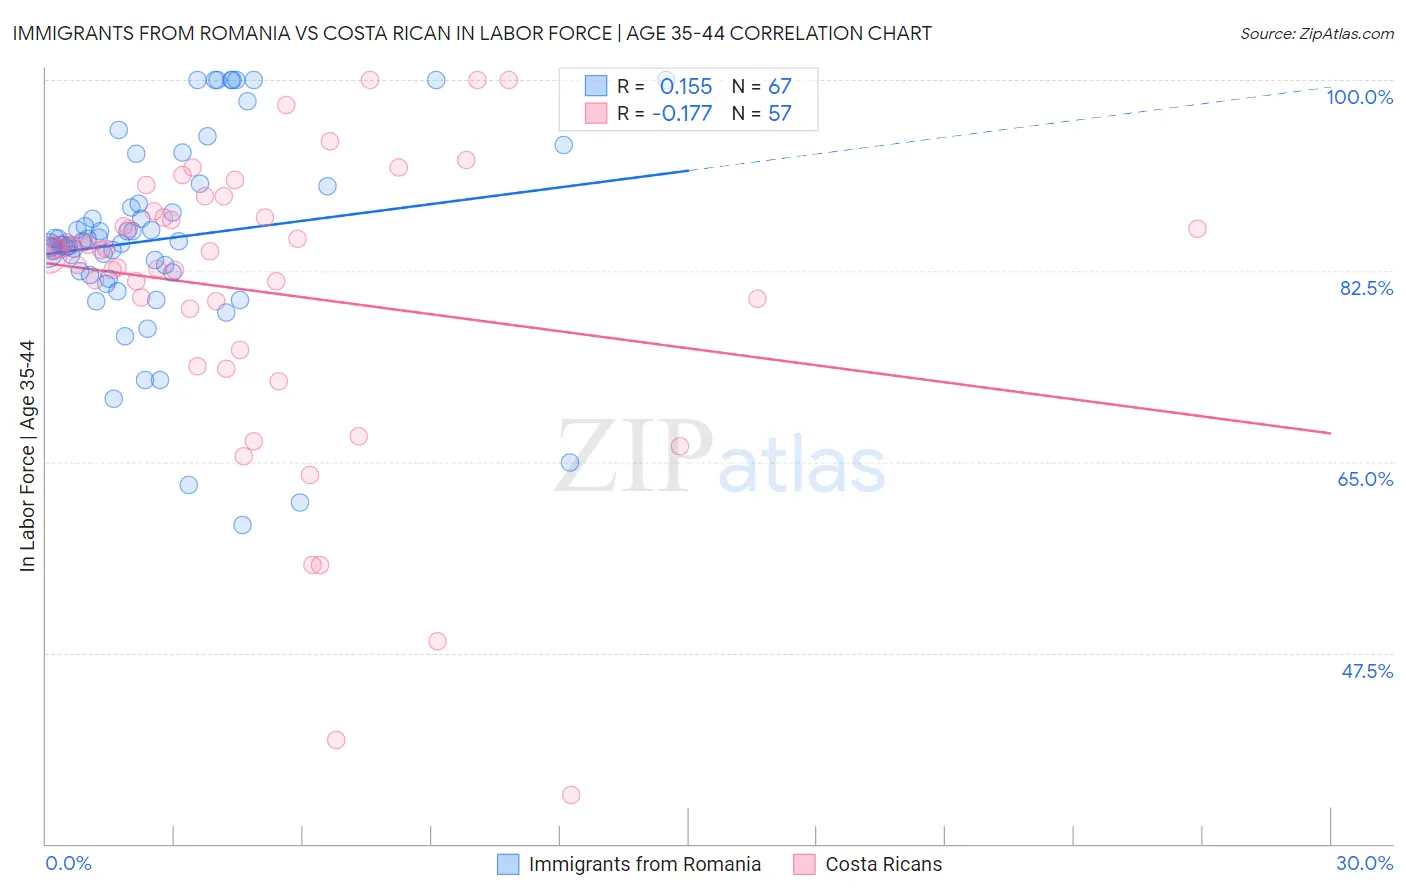
Immigrants from Romania vs Costa Rican In Labor Force | Age 35-44 Correlation Chart

The statistical analysis conducted on geographies consisting of 256,974,600 people shows a poor positive correlation between the proportion of Immigrants from Romania and labor force participation rate among population between the ages 35 and 44 in the United States with a correlation coefficient (R) of 0.155 and weighted average of 84.8%. Similarly, the statistical analysis conducted on geographies consisting of 253,534,047 people shows a poor negative correlation between the proportion of Costa Ricans and labor force participation rate among population between the ages 35 and 44 in the United States with a correlation coefficient (R) of -0.177 and weighted average of 84.3%, a difference of 0.56%.
Immigrants from Romania vs Costa Rican In Labor Force | Age 35-44

In Labor Force | Age 35-44 Correlation Summary

MeasurementImmigrants from RomaniaCosta Rican
Minimum59.2%34.5%
Maximum100.0%100.0%
Range40.8%65.5%
Mean85.5%80.6%
Median85.2%84.4%
Interquartile 25% (IQ1)82.1%77.2%
Interquartile 75% (IQ3)90.3%87.7%
Interquartile Range (IQR)8.2%10.6%
Standard Deviation (Sample)9.3%13.6%
Standard Deviation (Population)9.2%13.5%

Similar Demographics by In Labor Force | Age 35-44

Demographics Similar to Immigrants from Romania by In Labor Force | Age 35-44

In terms of in labor force | age 35-44, the demographic groups most similar to Immigrants from Romania are Immigrants from Bahamas (84.8%, a difference of 0.0%), South American (84.8%, a difference of 0.010%), Immigrants from Argentina (84.8%, a difference of 0.010%), Immigrants from Russia (84.8%, a difference of 0.010%), and Immigrants from Southern Europe (84.8%, a difference of 0.020%).
DemographicsRating | RankIn Labor Force | Age 35-44
Immigrants | Czechoslovakia
95.9
/100
|
#100
Exceptional
84.8%
Immigrants | Australia
95.5
/100
|
#101
Exceptional
84.8%
Immigrants | Southern Europe
95.3
/100
|
#102
Exceptional
84.8%
Immigrants | Belarus
95.3
/100
|
#103
Exceptional
84.8%
Immigrants | Sweden
95.2
/100
|
#104
Exceptional
84.8%
South Americans
95.0
/100
|
#105
Exceptional
84.8%
Immigrants | Bahamas
94.8
/100
|
#106
Exceptional
84.8%
Immigrants | Romania
94.7
/100
|
#107
Exceptional
84.8%
Immigrants | Argentina
94.5
/100
|
#108
Exceptional
84.8%
Immigrants | Russia
94.5
/100
|
#109
Exceptional
84.8%
Filipinos
93.8
/100
|
#110
Exceptional
84.7%
Ukrainians
93.5
/100
|
#111
Exceptional
84.7%
Immigrants | Western Africa
93.4
/100
|
#112
Exceptional
84.7%
Uruguayans
93.3
/100
|
#113
Exceptional
84.7%
Chileans
93.2
/100
|
#114
Exceptional
84.7%

Demographics Similar to Costa Ricans by In Labor Force | Age 35-44

In terms of in labor force | age 35-44, the demographic groups most similar to Costa Ricans are Armenian (84.3%, a difference of 0.0%), Australian (84.3%, a difference of 0.0%), Dutch (84.3%, a difference of 0.0%), Immigrants from West Indies (84.3%, a difference of 0.010%), and Korean (84.3%, a difference of 0.010%).
DemographicsRating | RankIn Labor Force | Age 35-44
Northern Europeans
44.1
/100
|
#178
Average
84.3%
Immigrants | South Africa
42.8
/100
|
#179
Average
84.3%
Danes
38.8
/100
|
#180
Fair
84.3%
Immigrants | West Indies
36.4
/100
|
#181
Fair
84.3%
Koreans
36.3
/100
|
#182
Fair
84.3%
Barbadians
36.2
/100
|
#183
Fair
84.3%
Armenians
35.6
/100
|
#184
Fair
84.3%
Costa Ricans
35.3
/100
|
#185
Fair
84.3%
Australians
35.1
/100
|
#186
Fair
84.3%
Dutch
34.8
/100
|
#187
Fair
84.3%
South Africans
34.1
/100
|
#188
Fair
84.3%
Immigrants | Denmark
33.7
/100
|
#189
Fair
84.3%
Portuguese
31.9
/100
|
#190
Fair
84.3%
Immigrants | Philippines
27.9
/100
|
#191
Fair
84.2%
Immigrants | Vietnam
27.4
/100
|
#192
Fair
84.2%