Immigrants from Poland vs Immigrants from Mexico In Labor Force | Age 35-44

COMPARE

Immigrants from Poland
Race
Ancestry
AfghanAfricanAlaska NativeAlaskan AthabascanAlbanianAleutAlsatianAmericanApacheArabArapahoArgentineanArmenianAssyrian/Chaldean/SyriacAustralianAustrianBahamianBangladeshiBarbadianBasqueBelgianBelizeanBermudanBhutaneseBlackfeetBolivianBrazilianBritishBritish West IndianBulgarianBurmeseCajunCambodianCanadianCape VerdeanCarpatho RusynCelticCentral AmericanCentral American IndianCherokeeCheyenneChickasawChileanChineseChippewaChoctawColombianColvilleComancheCosta RicanCreeCreekCroatianCrowCubanCypriotCzechCzechoslovakianDanishDelawareDominicanDutchDutch West IndianEastern EuropeanEcuadorianEgyptianEnglishEstonianEthiopianEuropeanFijianFilipinoFinnishFrenchFrench American IndianFrench CanadianGermanGerman RussianGhanaianGreekGuamanian/ChamorroGuatemalanGuyaneseHaitianHmongHonduranHopiHoumaHungarianIcelanderIndian (Asian)IndonesianInupiatIranianIraqiIrishIroquoisIsraeliItalianJamaicanJapaneseJordanianKenyanKiowaKoreanLaotianLatvianLebaneseLiberianLithuanianLumbeeLuxembourgerMacedonianMalaysianMalteseMarshalleseMenomineeMexicanMexican American IndianMongolianMoroccanNative HawaiianNavajoNepaleseNew ZealanderNicaraguanNigerianNorthern EuropeanNorwegianOkinawanOsageOttawaPaiutePakistaniPalestinianPanamanianParaguayanPennsylvania GermanPeruvianPimaPolishPortuguesePotawatomiPuebloPuerto RicanPuget Sound SalishRomanianRussianSalvadoranSamoanScandinavianScotch-IrishScottishSeminoleSenegaleseSerbianShoshoneSierra LeoneanSiouxSlavicSlovakSloveneSomaliSouth AfricanSouth AmericanSouth American IndianSoviet UnionSpaniardSpanishSpanish AmericanSpanish American IndianSri LankanSubsaharan AfricanSudaneseSwedishSwissSyrianTaiwaneseThaiTlingit-HaidaTohono O'OdhamTonganTrinidadian and TobagonianTsimshianTurkishU.S. Virgin IslanderUgandanUkrainianUruguayanUteVenezuelanVietnameseWelshWest IndianYakamaYaquiYugoslavianYumanYup'ikZimbabwean
Immigration
NonimmigrantsImmigrantsAfghanistanAfricaAlbaniaArgentinaArmeniaAsiaAustraliaAustriaBahamasBangladeshBarbadosBelarusBelgiumBelizeBoliviaBosnia and HerzegovinaBrazilBulgariaBurma/MyanmarCabo VerdeCambodiaCameroonCanadaCaribbeanCentral AmericaChileChinaColombiaCongoCosta RicaCroatiaCubaCzechoslovakiaDenmarkDominicaDominican RepublicEastern AfricaEastern AsiaEastern EuropeEcuadorEgyptEl SalvadorEnglandEritreaEthiopiaEuropeFijiFranceGermanyGhanaGreeceGrenadaGuatemalaGuyanaHaitiHondurasHong KongHungaryIndiaIndonesiaIranIraqIrelandIsraelItalyJamaicaJapanJordanKazakhstanKenyaKoreaKuwaitLaosLatin AmericaLatviaLebanonLiberiaLithuaniaMalaysiaMicronesiaMiddle AfricaMoldovaMoroccoNepalNetherlandsNicaraguaNigeriaNorth AmericaNorth MacedoniaNorthern AfricaNorthern EuropeNorwayOceaniaPakistanPanamaPeruPhilippinesPolandPortugalRomaniaRussiaSaudi ArabiaScotlandSenegalSerbiaSierra LeoneSingaporeSomaliaSouth AfricaSouth AmericaSouth Central AsiaSouth Eastern AsiaSouthern EuropeSpainSri LankaSt. Vincent and the GrenadinesSudanSwedenSwitzerlandSyriaTaiwanThailandTrinidad and TobagoTurkeyUgandaUkraineUruguayUzbekistanVenezuelaVietnamWest IndiesWestern AfricaWestern AsiaWestern EuropeYemenZaireZimbabweAzores
Immigrants from Mexico
Race
Ancestry
AfghanAfricanAlaska NativeAlaskan AthabascanAlbanianAleutAlsatianAmericanApacheArabArapahoArgentineanArmenianAssyrian/Chaldean/SyriacAustralianAustrianBahamianBangladeshiBarbadianBasqueBelgianBelizeanBermudanBhutaneseBlackfeetBolivianBrazilianBritishBritish West IndianBulgarianBurmeseCajunCambodianCanadianCape VerdeanCarpatho RusynCelticCentral AmericanCentral American IndianCherokeeCheyenneChickasawChileanChineseChippewaChoctawColombianColvilleComancheCosta RicanCreeCreekCroatianCrowCubanCypriotCzechCzechoslovakianDanishDelawareDominicanDutchDutch West IndianEastern EuropeanEcuadorianEgyptianEnglishEstonianEthiopianEuropeanFijianFilipinoFinnishFrenchFrench American IndianFrench CanadianGermanGerman RussianGhanaianGreekGuamanian/ChamorroGuatemalanGuyaneseHaitianHmongHonduranHopiHoumaHungarianIcelanderIndian (Asian)IndonesianInupiatIranianIraqiIrishIroquoisIsraeliItalianJamaicanJapaneseJordanianKenyanKiowaKoreanLaotianLatvianLebaneseLiberianLithuanianLumbeeLuxembourgerMacedonianMalaysianMalteseMarshalleseMenomineeMexicanMexican American IndianMongolianMoroccanNative HawaiianNavajoNepaleseNew ZealanderNicaraguanNigerianNorthern EuropeanNorwegianOkinawanOsageOttawaPaiutePakistaniPalestinianPanamanianParaguayanPennsylvania GermanPeruvianPimaPolishPortuguesePotawatomiPuebloPuerto RicanPuget Sound SalishRomanianRussianSalvadoranSamoanScandinavianScotch-IrishScottishSeminoleSenegaleseSerbianShoshoneSierra LeoneanSiouxSlavicSlovakSloveneSomaliSouth AfricanSouth AmericanSouth American IndianSoviet UnionSpaniardSpanishSpanish AmericanSpanish American IndianSri LankanSubsaharan AfricanSudaneseSwedishSwissSyrianTaiwaneseThaiTlingit-HaidaTohono O'OdhamTonganTrinidadian and TobagonianTsimshianTurkishU.S. Virgin IslanderUgandanUkrainianUruguayanUteVenezuelanVietnameseWelshWest IndianYakamaYaquiYugoslavianYumanYup'ikZimbabwean
Immigration
NonimmigrantsImmigrantsAfghanistanAfricaAlbaniaArgentinaArmeniaAsiaAustraliaAustriaBahamasBangladeshBarbadosBelarusBelgiumBelizeBoliviaBosnia and HerzegovinaBrazilBulgariaBurma/MyanmarCabo VerdeCambodiaCameroonCanadaCaribbeanCentral AmericaChileChinaColombiaCongoCosta RicaCroatiaCubaCzechoslovakiaDenmarkDominicaDominican RepublicEastern AfricaEastern AsiaEastern EuropeEcuadorEgyptEl SalvadorEnglandEritreaEthiopiaEuropeFijiFranceGermanyGhanaGreeceGrenadaGuatemalaGuyanaHaitiHondurasHong KongHungaryIndiaIndonesiaIranIraqIrelandIsraelItalyJamaicaJapanJordanKazakhstanKenyaKoreaKuwaitLaosLatin AmericaLatviaLebanonLiberiaLithuaniaMalaysiaMexicoMicronesiaMiddle AfricaMoldovaMoroccoNepalNetherlandsNicaraguaNigeriaNorth AmericaNorth MacedoniaNorthern AfricaNorthern EuropeNorwayOceaniaPakistanPanamaPeruPhilippinesPortugalRomaniaRussiaSaudi ArabiaScotlandSenegalSerbiaSierra LeoneSingaporeSomaliaSouth AfricaSouth AmericaSouth Central AsiaSouth Eastern AsiaSouthern EuropeSpainSri LankaSt. Vincent and the GrenadinesSudanSwedenSwitzerlandSyriaTaiwanThailandTrinidad and TobagoTurkeyUgandaUkraineUruguayUzbekistanVenezuelaVietnamWest IndiesWestern AfricaWestern AsiaWestern EuropeYemenZaireZimbabweAzores
In Labor Force | Age 35-44
Income
Poverty
Unemployment
Labor Participation
Family Structure
Vehicle Availability
Education Level
Disability

In Labor Force | Age 35-44 Comparison

Immigrants from Poland

Immigrants from Mexico

Exceptional
Tragic
85.2%
IN LABOR FORCE | AGE 35-44
99.8/ 100
METRIC RATING
38th/ 347
METRIC RANK
81.5%
IN LABOR FORCE | AGE 35-44
0.0/ 100
METRIC RATING
315th/ 347
METRIC RANK

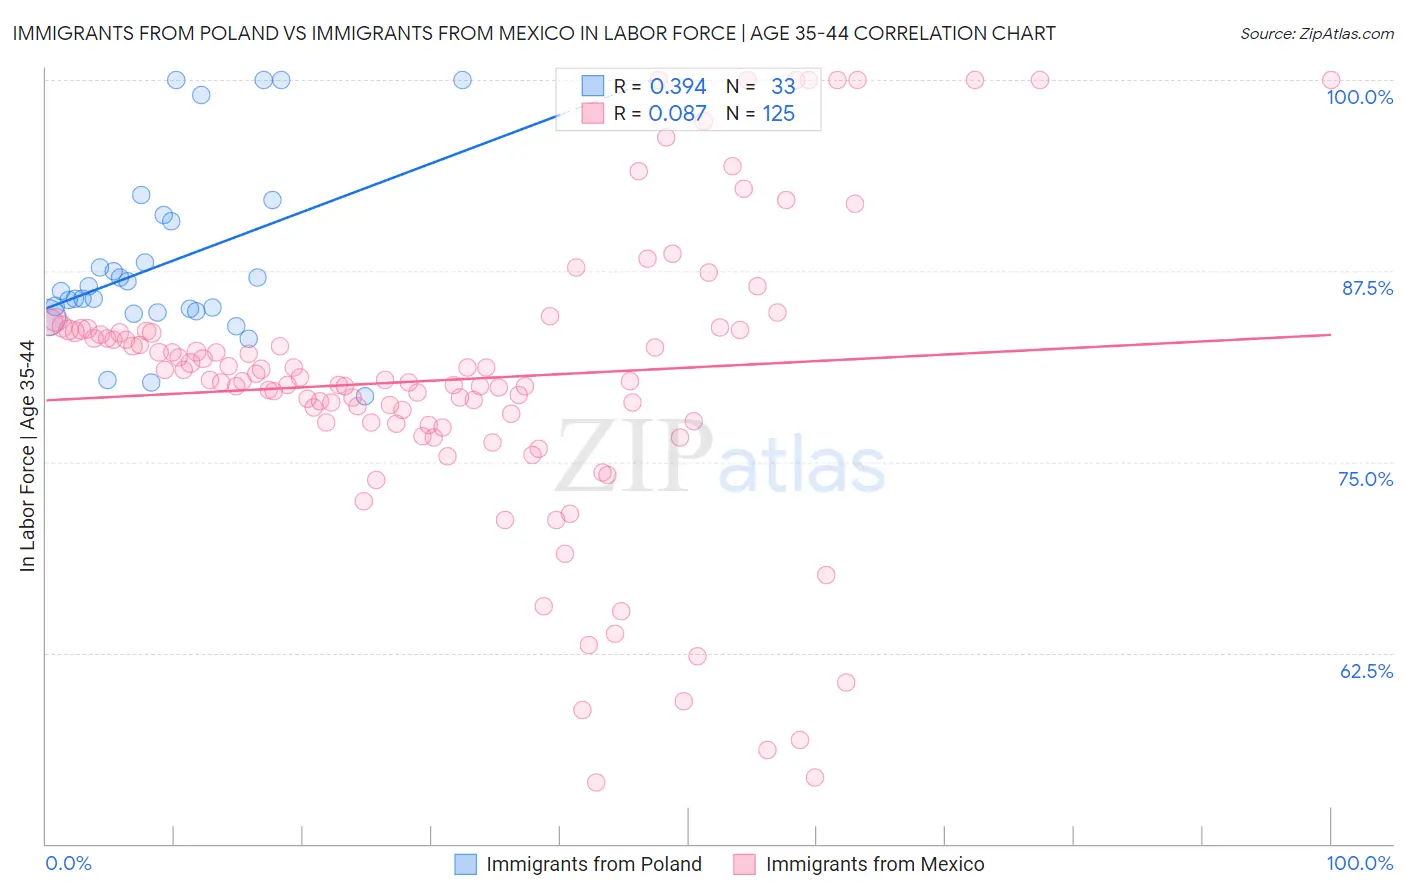
Immigrants from Poland vs Immigrants from Mexico In Labor Force | Age 35-44 Correlation Chart

The statistical analysis conducted on geographies consisting of 304,792,655 people shows a mild positive correlation between the proportion of Immigrants from Poland and labor force participation rate among population between the ages 35 and 44 in the United States with a correlation coefficient (R) of 0.394 and weighted average of 85.2%. Similarly, the statistical analysis conducted on geographies consisting of 513,440,276 people shows a slight positive correlation between the proportion of Immigrants from Mexico and labor force participation rate among population between the ages 35 and 44 in the United States with a correlation coefficient (R) of 0.087 and weighted average of 81.5%, a difference of 4.6%.
Immigrants from Poland vs Immigrants from Mexico In Labor Force | Age 35-44

In Labor Force | Age 35-44 Correlation Summary

MeasurementImmigrants from PolandImmigrants from Mexico
Minimum79.3%54.0%
Maximum100.0%100.0%
Range20.7%46.0%
Mean88.1%80.4%
Median86.2%80.3%
Interquartile 25% (IQ1)84.9%77.5%
Interquartile 75% (IQ3)90.9%83.6%
Interquartile Range (IQR)6.1%6.1%
Standard Deviation (Sample)5.8%9.6%
Standard Deviation (Population)5.7%9.6%

Similar Demographics by In Labor Force | Age 35-44

Demographics Similar to Immigrants from Poland by In Labor Force | Age 35-44

In terms of in labor force | age 35-44, the demographic groups most similar to Immigrants from Poland are Eastern European (85.2%, a difference of 0.0%), Kenyan (85.2%, a difference of 0.010%), Immigrants from Bulgaria (85.2%, a difference of 0.010%), Immigrants from Zimbabwe (85.2%, a difference of 0.010%), and Macedonian (85.2%, a difference of 0.010%).
DemographicsRating | RankIn Labor Force | Age 35-44
Czechs
99.9
/100
|
#31
Exceptional
85.3%
Immigrants | India
99.9
/100
|
#32
Exceptional
85.3%
Ugandans
99.9
/100
|
#33
Exceptional
85.3%
Immigrants | Nepal
99.9
/100
|
#34
Exceptional
85.3%
Estonians
99.9
/100
|
#35
Exceptional
85.3%
Immigrants | Morocco
99.8
/100
|
#36
Exceptional
85.2%
Kenyans
99.8
/100
|
#37
Exceptional
85.2%
Immigrants | Poland
99.8
/100
|
#38
Exceptional
85.2%
Eastern Europeans
99.8
/100
|
#39
Exceptional
85.2%
Immigrants | Bulgaria
99.8
/100
|
#40
Exceptional
85.2%
Immigrants | Zimbabwe
99.8
/100
|
#41
Exceptional
85.2%
Macedonians
99.8
/100
|
#42
Exceptional
85.2%
Poles
99.8
/100
|
#43
Exceptional
85.2%
Lithuanians
99.8
/100
|
#44
Exceptional
85.2%
Cypriots
99.8
/100
|
#45
Exceptional
85.2%

Demographics Similar to Immigrants from Mexico by In Labor Force | Age 35-44

In terms of in labor force | age 35-44, the demographic groups most similar to Immigrants from Mexico are Cajun (81.5%, a difference of 0.020%), Comanche (81.5%, a difference of 0.020%), Cherokee (81.4%, a difference of 0.10%), Alaska Native (81.6%, a difference of 0.14%), and Mexican (81.6%, a difference of 0.14%).
DemographicsRating | RankIn Labor Force | Age 35-44
Immigrants | Central America
0.0
/100
|
#308
Tragic
82.0%
Cree
0.0
/100
|
#309
Tragic
82.0%
Blackfeet
0.0
/100
|
#310
Tragic
81.9%
Colville
0.0
/100
|
#311
Tragic
81.7%
Alaska Natives
0.0
/100
|
#312
Tragic
81.6%
Mexicans
0.0
/100
|
#313
Tragic
81.6%
Cajuns
0.0
/100
|
#314
Tragic
81.5%
Immigrants | Mexico
0.0
/100
|
#315
Tragic
81.5%
Comanche
0.0
/100
|
#316
Tragic
81.5%
Cherokee
0.0
/100
|
#317
Tragic
81.4%
Alaskan Athabascans
0.0
/100
|
#318
Tragic
81.3%
Inupiat
0.0
/100
|
#319
Tragic
80.9%
Chickasaw
0.0
/100
|
#320
Tragic
80.9%
Puerto Ricans
0.0
/100
|
#321
Tragic
80.7%
Paiute
0.0
/100
|
#322
Tragic
80.6%