Immigrants from Panama vs Immigrants from Central America In Labor Force | Age > 16
COMPARE
Immigrants from Panama
Immigrants from Central America
In Labor Force | Age > 16
In Labor Force | Age > 16 Comparison
Immigrants from Panama
Immigrants from Central America
65.1%
IN LABOR FORCE | AGE > 16
42.4/ 100
METRIC RATING
181st/ 347
METRIC RANK
64.7%
IN LABOR FORCE | AGE > 16
10.5/ 100
METRIC RATING
219th/ 347
METRIC RANK
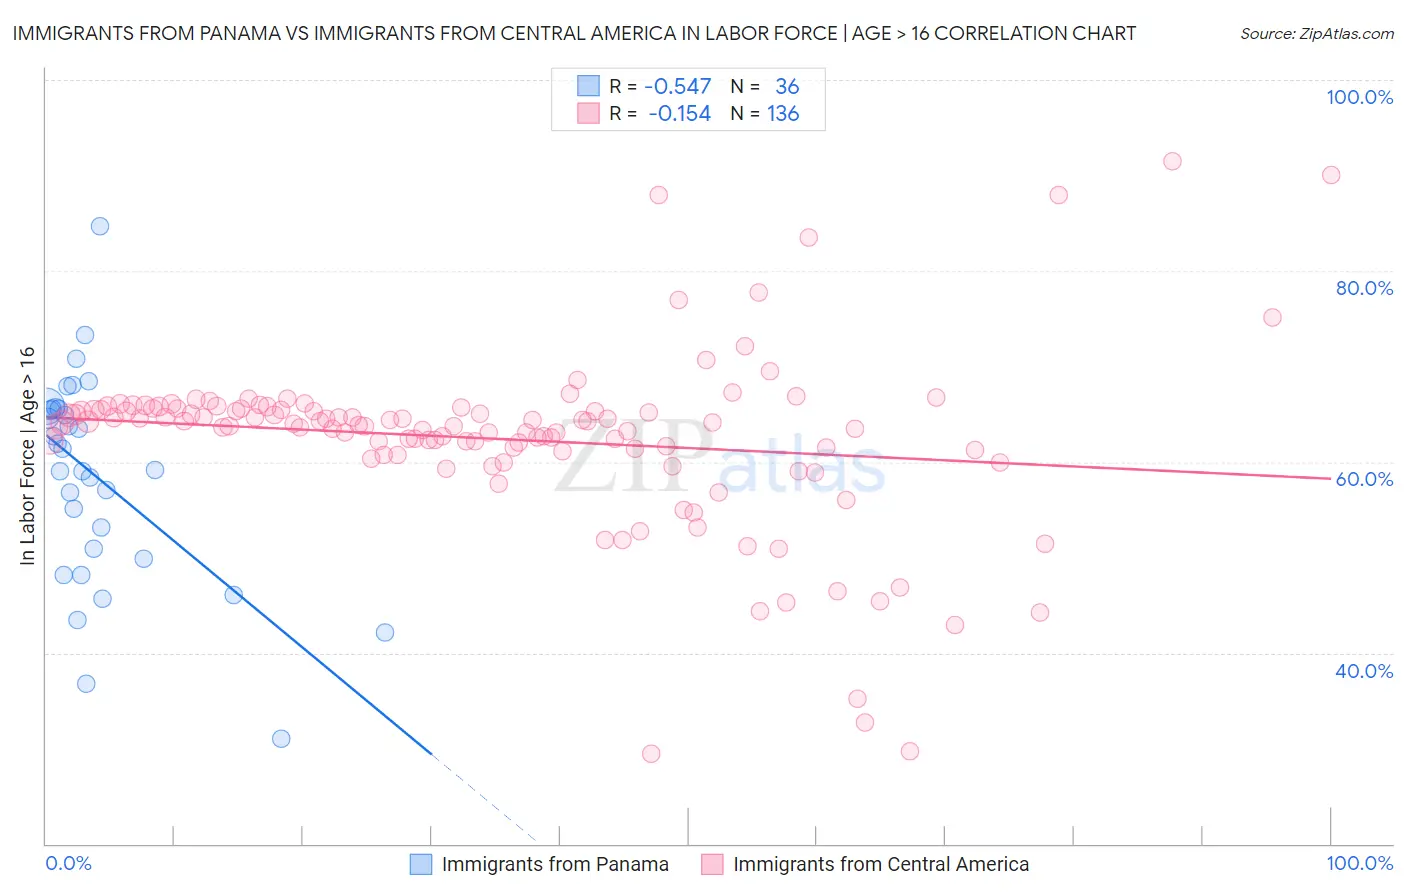
Immigrants from Panama vs Immigrants from Central America In Labor Force | Age > 16 Correlation Chart
The statistical analysis conducted on geographies consisting of 221,185,422 people shows a substantial negative correlation between the proportion of Immigrants from Panama and labor force participation rate among population ages 16 and over in the United States with a correlation coefficient (R) of -0.547 and weighted average of 65.1%. Similarly, the statistical analysis conducted on geographies consisting of 536,509,301 people shows a poor negative correlation between the proportion of Immigrants from Central America and labor force participation rate among population ages 16 and over in the United States with a correlation coefficient (R) of -0.154 and weighted average of 64.7%, a difference of 0.52%.
In Labor Force | Age > 16 Correlation Summary
| Measurement | Immigrants from Panama | Immigrants from Central America |
| Minimum | 31.0% | 29.4% |
| Maximum | 84.7% | 91.5% |
| Range | 53.7% | 62.1% |
| Mean | 58.4% | 62.4% |
| Median | 60.3% | 64.0% |
| Interquartile 25% (IQ1) | 50.4% | 61.2% |
| Interquartile 75% (IQ3) | 65.5% | 65.5% |
| Interquartile Range (IQR) | 15.1% | 4.3% |
| Standard Deviation (Sample) | 10.9% | 9.3% |
| Standard Deviation (Population) | 10.8% | 9.3% |
Similar Demographics by In Labor Force | Age > 16
Demographics Similar to Immigrants from Panama by In Labor Force | Age > 16
In terms of in labor force | age > 16, the demographic groups most similar to Immigrants from Panama are Immigrants from Haiti (65.1%, a difference of 0.010%), Immigrants from Latvia (65.1%, a difference of 0.010%), Immigrants from Nicaragua (65.1%, a difference of 0.020%), Soviet Union (65.0%, a difference of 0.020%), and Trinidadian and Tobagonian (65.1%, a difference of 0.030%).
| Demographics | Rating | Rank | In Labor Force | Age > 16 |
| Macedonians | 50.0 /100 | #174 | Average 65.1% |
| Nicaraguans | 49.7 /100 | #175 | Average 65.1% |
| Swedes | 47.4 /100 | #176 | Average 65.1% |
| Eastern Europeans | 46.2 /100 | #177 | Average 65.1% |
| Trinidadians and Tobagonians | 45.2 /100 | #178 | Average 65.1% |
| Immigrants | Haiti | 43.3 /100 | #179 | Average 65.1% |
| Immigrants | Latvia | 42.9 /100 | #180 | Average 65.1% |
| Immigrants | Panama | 42.4 /100 | #181 | Average 65.1% |
| Immigrants | Nicaragua | 41.1 /100 | #182 | Average 65.1% |
| Soviet Union | 40.5 /100 | #183 | Average 65.0% |
| Carpatho Rusyns | 40.0 /100 | #184 | Average 65.0% |
| Syrians | 40.0 /100 | #185 | Average 65.0% |
| Immigrants | Switzerland | 38.2 /100 | #186 | Fair 65.0% |
| Immigrants | Croatia | 35.7 /100 | #187 | Fair 65.0% |
| Immigrants | Portugal | 34.8 /100 | #188 | Fair 65.0% |
Demographics Similar to Immigrants from Central America by In Labor Force | Age > 16
In terms of in labor force | age > 16, the demographic groups most similar to Immigrants from Central America are Alsatian (64.7%, a difference of 0.010%), Belgian (64.7%, a difference of 0.020%), U.S. Virgin Islander (64.7%, a difference of 0.020%), Alaska Native (64.7%, a difference of 0.020%), and Immigrants from Micronesia (64.7%, a difference of 0.030%).
| Demographics | Rating | Rank | In Labor Force | Age > 16 |
| Alaskan Athabascans | 13.9 /100 | #212 | Poor 64.8% |
| Maltese | 13.8 /100 | #213 | Poor 64.8% |
| Estonians | 13.1 /100 | #214 | Poor 64.8% |
| Immigrants | Czechoslovakia | 12.3 /100 | #215 | Poor 64.8% |
| Belgians | 11.4 /100 | #216 | Poor 64.7% |
| U.S. Virgin Islanders | 11.3 /100 | #217 | Poor 64.7% |
| Alsatians | 10.7 /100 | #218 | Poor 64.7% |
| Immigrants | Central America | 10.5 /100 | #219 | Poor 64.7% |
| Alaska Natives | 9.9 /100 | #220 | Tragic 64.7% |
| Immigrants | Micronesia | 9.6 /100 | #221 | Tragic 64.7% |
| Hawaiians | 9.3 /100 | #222 | Tragic 64.7% |
| Immigrants | Belize | 9.2 /100 | #223 | Tragic 64.7% |
| Immigrants | Jamaica | 8.8 /100 | #224 | Tragic 64.7% |
| Croatians | 8.8 /100 | #225 | Tragic 64.7% |
| Europeans | 8.3 /100 | #226 | Tragic 64.7% |