Immigrants from Nigeria vs Immigrants from Iran In Labor Force | Age 16-19

COMPARE

Immigrants from Nigeria
Race
Ancestry
AfghanAfricanAlaska NativeAlaskan AthabascanAlbanianAleutAlsatianAmericanApacheArabArapahoArgentineanArmenianAssyrian/Chaldean/SyriacAustralianAustrianBahamianBangladeshiBarbadianBasqueBelgianBelizeanBermudanBhutaneseBlackfeetBolivianBrazilianBritishBritish West IndianBulgarianBurmeseCajunCambodianCanadianCape VerdeanCarpatho RusynCelticCentral AmericanCentral American IndianCherokeeCheyenneChickasawChileanChineseChippewaChoctawColombianColvilleComancheCosta RicanCreeCreekCroatianCrowCubanCypriotCzechCzechoslovakianDanishDelawareDominicanDutchDutch West IndianEastern EuropeanEcuadorianEgyptianEnglishEstonianEthiopianEuropeanFijianFilipinoFinnishFrenchFrench American IndianFrench CanadianGermanGerman RussianGhanaianGreekGuamanian/ChamorroGuatemalanGuyaneseHaitianHmongHonduranHopiHoumaHungarianIcelanderIndian (Asian)IndonesianInupiatIranianIraqiIrishIroquoisIsraeliItalianJamaicanJapaneseJordanianKenyanKiowaKoreanLaotianLatvianLebaneseLiberianLithuanianLumbeeLuxembourgerMacedonianMalaysianMalteseMarshalleseMenomineeMexicanMexican American IndianMongolianMoroccanNative HawaiianNavajoNepaleseNew ZealanderNicaraguanNigerianNorthern EuropeanNorwegianOkinawanOsageOttawaPaiutePakistaniPalestinianPanamanianParaguayanPennsylvania GermanPeruvianPimaPolishPortuguesePotawatomiPuebloPuerto RicanPuget Sound SalishRomanianRussianSalvadoranSamoanScandinavianScotch-IrishScottishSeminoleSenegaleseSerbianShoshoneSierra LeoneanSiouxSlavicSlovakSloveneSomaliSouth AfricanSouth AmericanSouth American IndianSoviet UnionSpaniardSpanishSpanish AmericanSpanish American IndianSri LankanSubsaharan AfricanSudaneseSwedishSwissSyrianTaiwaneseThaiTlingit-HaidaTohono O'OdhamTonganTrinidadian and TobagonianTsimshianTurkishU.S. Virgin IslanderUgandanUkrainianUruguayanUteVenezuelanVietnameseWelshWest IndianYakamaYaquiYugoslavianYumanYup'ikZimbabwean
Immigration
NonimmigrantsImmigrantsAfghanistanAfricaAlbaniaArgentinaArmeniaAsiaAustraliaAustriaBahamasBangladeshBarbadosBelarusBelgiumBelizeBoliviaBosnia and HerzegovinaBrazilBulgariaBurma/MyanmarCabo VerdeCambodiaCameroonCanadaCaribbeanCentral AmericaChileChinaColombiaCongoCosta RicaCroatiaCubaCzechoslovakiaDenmarkDominicaDominican RepublicEastern AfricaEastern AsiaEastern EuropeEcuadorEgyptEl SalvadorEnglandEritreaEthiopiaEuropeFijiFranceGermanyGhanaGreeceGrenadaGuatemalaGuyanaHaitiHondurasHong KongHungaryIndiaIndonesiaIraqIrelandIsraelItalyJamaicaJapanJordanKazakhstanKenyaKoreaKuwaitLaosLatin AmericaLatviaLebanonLiberiaLithuaniaMalaysiaMexicoMicronesiaMiddle AfricaMoldovaMoroccoNepalNetherlandsNicaraguaNigeriaNorth AmericaNorth MacedoniaNorthern AfricaNorthern EuropeNorwayOceaniaPakistanPanamaPeruPhilippinesPolandPortugalRomaniaRussiaSaudi ArabiaScotlandSenegalSerbiaSierra LeoneSingaporeSomaliaSouth AfricaSouth AmericaSouth Central AsiaSouth Eastern AsiaSouthern EuropeSpainSri LankaSt. Vincent and the GrenadinesSudanSwedenSwitzerlandSyriaTaiwanThailandTrinidad and TobagoTurkeyUgandaUkraineUruguayUzbekistanVenezuelaVietnamWest IndiesWestern AfricaWestern AsiaWestern EuropeYemenZaireZimbabweAzores
Immigrants from Iran
Race
Ancestry
AfghanAfricanAlaska NativeAlaskan AthabascanAlbanianAleutAlsatianAmericanApacheArabArapahoArgentineanArmenianAssyrian/Chaldean/SyriacAustralianAustrianBahamianBangladeshiBarbadianBasqueBelgianBelizeanBermudanBhutaneseBlackfeetBolivianBrazilianBritishBritish West IndianBulgarianBurmeseCajunCambodianCanadianCape VerdeanCarpatho RusynCelticCentral AmericanCentral American IndianCherokeeCheyenneChickasawChileanChineseChippewaChoctawColombianColvilleComancheCosta RicanCreeCreekCroatianCrowCubanCypriotCzechCzechoslovakianDanishDelawareDominicanDutchDutch West IndianEastern EuropeanEcuadorianEgyptianEnglishEstonianEthiopianEuropeanFijianFilipinoFinnishFrenchFrench American IndianFrench CanadianGermanGerman RussianGhanaianGreekGuamanian/ChamorroGuatemalanGuyaneseHaitianHmongHonduranHopiHoumaHungarianIcelanderIndian (Asian)IndonesianInupiatIranianIraqiIrishIroquoisIsraeliItalianJamaicanJapaneseJordanianKenyanKiowaKoreanLaotianLatvianLebaneseLiberianLithuanianLumbeeLuxembourgerMacedonianMalaysianMalteseMarshalleseMenomineeMexicanMexican American IndianMongolianMoroccanNative HawaiianNavajoNepaleseNew ZealanderNicaraguanNigerianNorthern EuropeanNorwegianOkinawanOsageOttawaPaiutePakistaniPalestinianPanamanianParaguayanPennsylvania GermanPeruvianPimaPolishPortuguesePotawatomiPuebloPuerto RicanPuget Sound SalishRomanianRussianSalvadoranSamoanScandinavianScotch-IrishScottishSeminoleSenegaleseSerbianShoshoneSierra LeoneanSiouxSlavicSlovakSloveneSomaliSouth AfricanSouth AmericanSouth American IndianSoviet UnionSpaniardSpanishSpanish AmericanSpanish American IndianSri LankanSubsaharan AfricanSudaneseSwedishSwissSyrianTaiwaneseThaiTlingit-HaidaTohono O'OdhamTonganTrinidadian and TobagonianTsimshianTurkishU.S. Virgin IslanderUgandanUkrainianUruguayanUteVenezuelanVietnameseWelshWest IndianYakamaYaquiYugoslavianYumanYup'ikZimbabwean
Immigration
NonimmigrantsImmigrantsAfghanistanAfricaAlbaniaArgentinaArmeniaAsiaAustraliaAustriaBahamasBangladeshBarbadosBelarusBelgiumBelizeBoliviaBosnia and HerzegovinaBrazilBulgariaBurma/MyanmarCabo VerdeCambodiaCameroonCanadaCaribbeanCentral AmericaChileChinaColombiaCongoCosta RicaCroatiaCubaCzechoslovakiaDenmarkDominicaDominican RepublicEastern AfricaEastern AsiaEastern EuropeEcuadorEgyptEl SalvadorEnglandEritreaEthiopiaEuropeFijiFranceGermanyGhanaGreeceGrenadaGuatemalaGuyanaHaitiHondurasHong KongHungaryIndiaIndonesiaIranIraqIrelandIsraelItalyJamaicaJapanJordanKazakhstanKenyaKoreaKuwaitLaosLatin AmericaLatviaLebanonLiberiaLithuaniaMalaysiaMexicoMicronesiaMiddle AfricaMoldovaMoroccoNepalNetherlandsNicaraguaNorth AmericaNorth MacedoniaNorthern AfricaNorthern EuropeNorwayOceaniaPakistanPanamaPeruPhilippinesPolandPortugalRomaniaRussiaSaudi ArabiaScotlandSenegalSerbiaSierra LeoneSingaporeSomaliaSouth AfricaSouth AmericaSouth Central AsiaSouth Eastern AsiaSouthern EuropeSpainSri LankaSt. Vincent and the GrenadinesSudanSwedenSwitzerlandSyriaTaiwanThailandTrinidad and TobagoTurkeyUgandaUkraineUruguayUzbekistanVenezuelaVietnamWest IndiesWestern AfricaWestern AsiaWestern EuropeYemenZaireZimbabweAzores
In Labor Force | Age 16-19
Income
Poverty
Unemployment
Labor Participation
Family Structure
Vehicle Availability
Education Level
Disability

In Labor Force | Age 16-19 Comparison

Immigrants from Nigeria

Immigrants from Iran

Poor
Tragic
35.8%
IN LABOR FORCE | AGE 16-19
16.8/ 100
METRIC RATING
203rd/ 347
METRIC RANK
32.0%
IN LABOR FORCE | AGE 16-19
0.0/ 100
METRIC RATING
310th/ 347
METRIC RANK

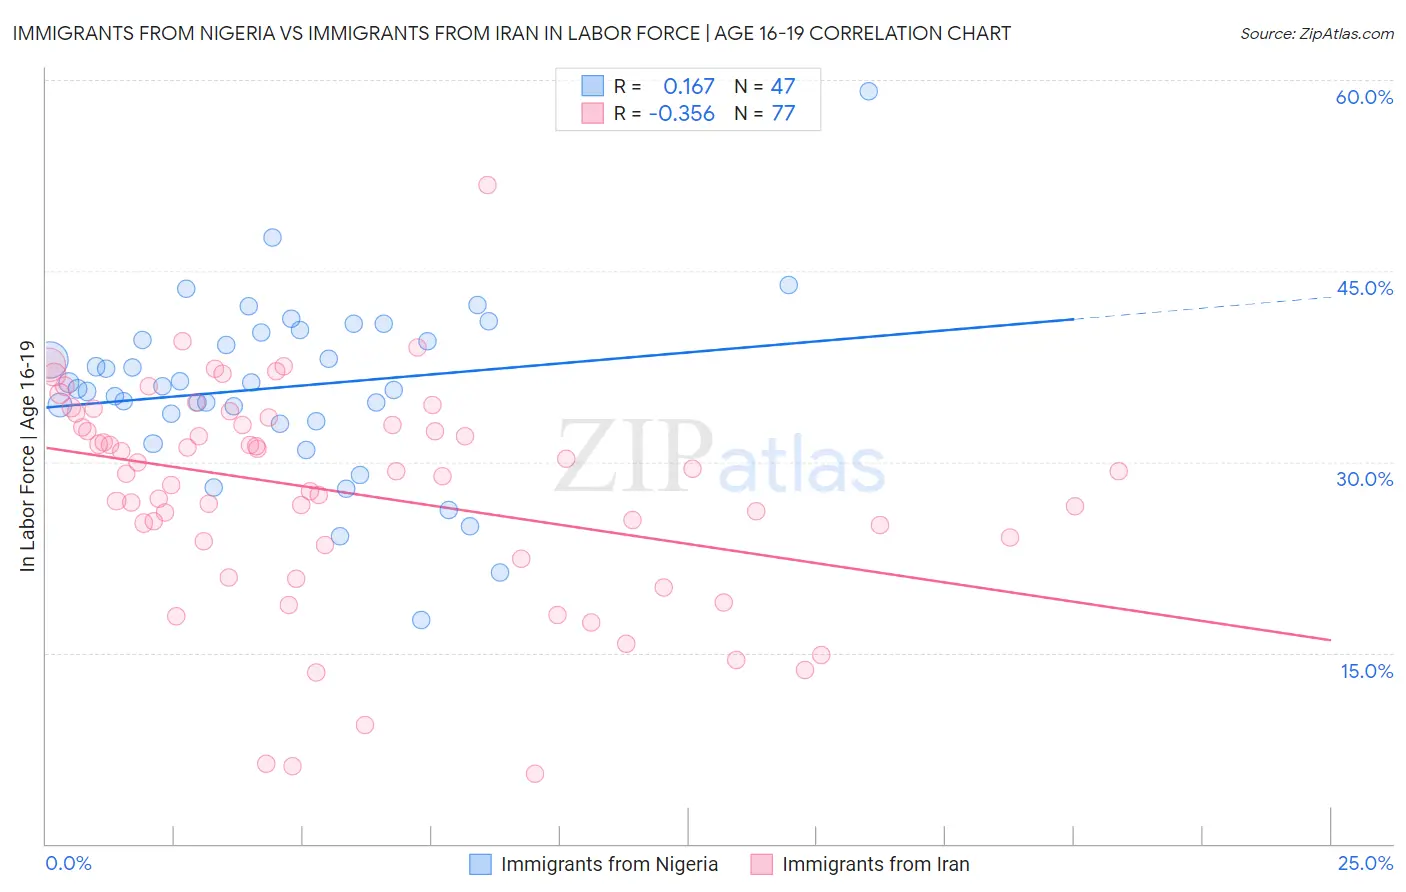
Immigrants from Nigeria vs Immigrants from Iran In Labor Force | Age 16-19 Correlation Chart

The statistical analysis conducted on geographies consisting of 283,352,648 people shows a poor positive correlation between the proportion of Immigrants from Nigeria and labor force participation rate among population between the ages 16 and 19 in the United States with a correlation coefficient (R) of 0.167 and weighted average of 35.8%. Similarly, the statistical analysis conducted on geographies consisting of 279,510,486 people shows a mild negative correlation between the proportion of Immigrants from Iran and labor force participation rate among population between the ages 16 and 19 in the United States with a correlation coefficient (R) of -0.356 and weighted average of 32.0%, a difference of 12.0%.
Immigrants from Nigeria vs Immigrants from Iran In Labor Force | Age 16-19

In Labor Force | Age 16-19 Correlation Summary

MeasurementImmigrants from NigeriaImmigrants from Iran
Minimum17.6%5.5%
Maximum59.1%51.8%
Range41.5%46.3%
Mean35.9%27.6%
Median35.9%29.3%
Interquartile 25% (IQ1)33.2%23.6%
Interquartile 75% (IQ3)40.2%33.2%
Interquartile Range (IQR)6.9%9.6%
Standard Deviation (Sample)7.0%8.5%
Standard Deviation (Population)6.9%8.5%

Similar Demographics by In Labor Force | Age 16-19

Demographics Similar to Immigrants from Nigeria by In Labor Force | Age 16-19

In terms of in labor force | age 16-19, the demographic groups most similar to Immigrants from Nigeria are Senegalese (35.9%, a difference of 0.060%), Alsatian (35.9%, a difference of 0.070%), Immigrants from Albania (35.8%, a difference of 0.17%), Immigrants from Sweden (35.9%, a difference of 0.18%), and South American Indian (35.8%, a difference of 0.21%).
DemographicsRating | RankIn Labor Force | Age 16-19
Mexican American Indians
21.1
/100
|
#196
Fair
36.0%
Immigrants | Serbia
21.0
/100
|
#197
Fair
36.0%
Immigrants | Northern Africa
19.9
/100
|
#198
Poor
35.9%
Immigrants | Norway
19.8
/100
|
#199
Poor
35.9%
Immigrants | Sweden
18.8
/100
|
#200
Poor
35.9%
Alsatians
17.5
/100
|
#201
Poor
35.9%
Senegalese
17.4
/100
|
#202
Poor
35.9%
Immigrants | Nigeria
16.8
/100
|
#203
Poor
35.8%
Immigrants | Albania
15.0
/100
|
#204
Poor
35.8%
South American Indians
14.6
/100
|
#205
Poor
35.8%
Chileans
14.6
/100
|
#206
Poor
35.8%
Immigrants | Eastern Europe
14.5
/100
|
#207
Poor
35.8%
Koreans
13.3
/100
|
#208
Poor
35.7%
Moroccans
12.7
/100
|
#209
Poor
35.7%
Immigrants | Switzerland
11.9
/100
|
#210
Poor
35.6%

Demographics Similar to Immigrants from Iran by In Labor Force | Age 16-19

In terms of in labor force | age 16-19, the demographic groups most similar to Immigrants from Iran are Immigrants from Eastern Asia (32.0%, a difference of 0.14%), Navajo (32.1%, a difference of 0.32%), Indian (Asian) (31.9%, a difference of 0.37%), Immigrants from Belize (31.8%, a difference of 0.51%), and Hopi (31.8%, a difference of 0.51%).
DemographicsRating | RankIn Labor Force | Age 16-19
Immigrants | Dominica
0.0
/100
|
#303
Tragic
32.5%
Israelis
0.0
/100
|
#304
Tragic
32.4%
Nicaraguans
0.0
/100
|
#305
Tragic
32.4%
Spanish American Indians
0.0
/100
|
#306
Tragic
32.4%
Immigrants | Jamaica
0.0
/100
|
#307
Tragic
32.2%
Navajo
0.0
/100
|
#308
Tragic
32.1%
Immigrants | Eastern Asia
0.0
/100
|
#309
Tragic
32.0%
Immigrants | Iran
0.0
/100
|
#310
Tragic
32.0%
Indians (Asian)
0.0
/100
|
#311
Tragic
31.9%
Immigrants | Belize
0.0
/100
|
#312
Tragic
31.8%
Hopi
0.0
/100
|
#313
Tragic
31.8%
Cubans
0.0
/100
|
#314
Tragic
31.8%
Immigrants | West Indies
0.0
/100
|
#315
Tragic
31.7%
Filipinos
0.0
/100
|
#316
Tragic
31.7%
Immigrants | Nicaragua
0.0
/100
|
#317
Tragic
31.6%