Immigrants from Lebanon vs Jamaican In Labor Force | Age 35-44
COMPARE
Immigrants from Lebanon
Jamaican
In Labor Force | Age 35-44
In Labor Force | Age 35-44 Comparison
Immigrants from Lebanon
Jamaicans
82.7%
IN LABOR FORCE | AGE 35-44
0.0/ 100
METRIC RATING
295th/ 347
METRIC RANK
84.4%
IN LABOR FORCE | AGE 35-44
62.7/ 100
METRIC RATING
158th/ 347
METRIC RANK
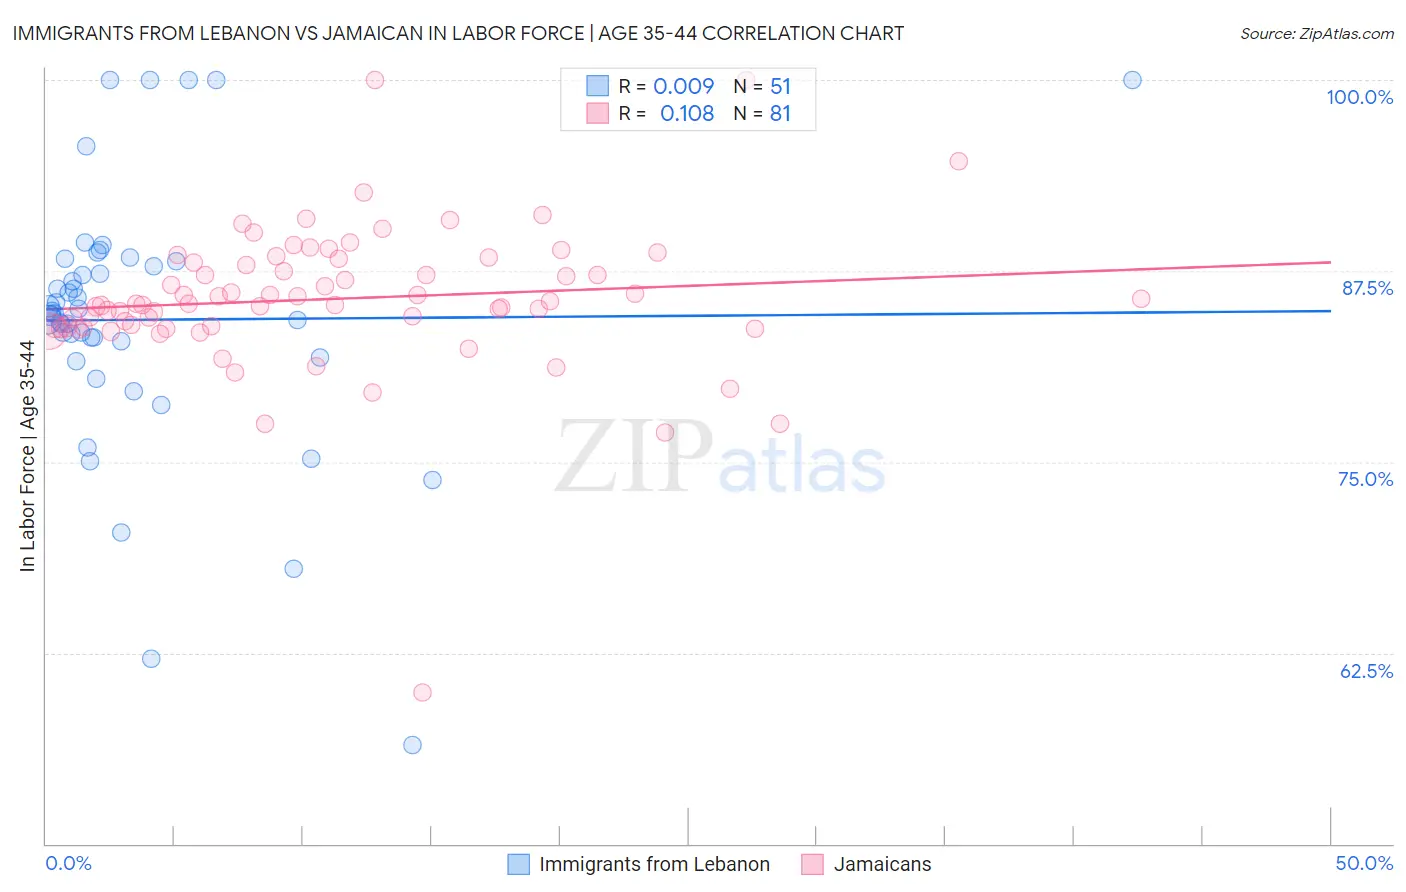
Immigrants from Lebanon vs Jamaican In Labor Force | Age 35-44 Correlation Chart
The statistical analysis conducted on geographies consisting of 217,122,432 people shows no correlation between the proportion of Immigrants from Lebanon and labor force participation rate among population between the ages 35 and 44 in the United States with a correlation coefficient (R) of 0.009 and weighted average of 82.7%. Similarly, the statistical analysis conducted on geographies consisting of 367,727,365 people shows a poor positive correlation between the proportion of Jamaicans and labor force participation rate among population between the ages 35 and 44 in the United States with a correlation coefficient (R) of 0.108 and weighted average of 84.4%, a difference of 2.2%.
In Labor Force | Age 35-44 Correlation Summary
| Measurement | Immigrants from Lebanon | Jamaican |
| Minimum | 56.5% | 59.9% |
| Maximum | 100.0% | 100.0% |
| Range | 43.5% | 40.1% |
| Mean | 84.3% | 85.7% |
| Median | 84.7% | 85.4% |
| Interquartile 25% (IQ1) | 81.8% | 83.8% |
| Interquartile 75% (IQ3) | 88.1% | 88.2% |
| Interquartile Range (IQR) | 6.3% | 4.3% |
| Standard Deviation (Sample) | 8.6% | 4.9% |
| Standard Deviation (Population) | 8.5% | 4.9% |
Similar Demographics by In Labor Force | Age 35-44
Demographics Similar to Immigrants from Lebanon by In Labor Force | Age 35-44
In terms of in labor force | age 35-44, the demographic groups most similar to Immigrants from Lebanon are Potawatomi (82.7%, a difference of 0.050%), Mexican American Indian (82.6%, a difference of 0.10%), Hmong (82.6%, a difference of 0.10%), Ottawa (82.6%, a difference of 0.12%), and Spanish American (82.8%, a difference of 0.13%).
| Demographics | Rating | Rank | In Labor Force | Age 35-44 |
| Puget Sound Salish | 0.0 /100 | #288 | Tragic 82.9% |
| Chippewa | 0.0 /100 | #289 | Tragic 82.9% |
| Africans | 0.0 /100 | #290 | Tragic 82.9% |
| Pennsylvania Germans | 0.0 /100 | #291 | Tragic 82.9% |
| Immigrants | Latin America | 0.0 /100 | #292 | Tragic 82.8% |
| Spanish Americans | 0.0 /100 | #293 | Tragic 82.8% |
| Potawatomi | 0.0 /100 | #294 | Tragic 82.7% |
| Immigrants | Lebanon | 0.0 /100 | #295 | Tragic 82.7% |
| Mexican American Indians | 0.0 /100 | #296 | Tragic 82.6% |
| Hmong | 0.0 /100 | #297 | Tragic 82.6% |
| Ottawa | 0.0 /100 | #298 | Tragic 82.6% |
| Tlingit-Haida | 0.0 /100 | #299 | Tragic 82.5% |
| Central American Indians | 0.0 /100 | #300 | Tragic 82.5% |
| Spanish American Indians | 0.0 /100 | #301 | Tragic 82.5% |
| Americans | 0.0 /100 | #302 | Tragic 82.4% |
Demographics Similar to Jamaicans by In Labor Force | Age 35-44
In terms of in labor force | age 35-44, the demographic groups most similar to Jamaicans are Immigrants from Israel (84.4%, a difference of 0.010%), Immigrants from Austria (84.4%, a difference of 0.010%), Immigrants from Switzerland (84.5%, a difference of 0.020%), Immigrants from Senegal (84.4%, a difference of 0.020%), and Immigrants from Kazakhstan (84.4%, a difference of 0.020%).
| Demographics | Rating | Rank | In Labor Force | Age 35-44 |
| Romanians | 72.1 /100 | #151 | Good 84.5% |
| Immigrants | Taiwan | 71.4 /100 | #152 | Good 84.5% |
| Trinidadians and Tobagonians | 69.5 /100 | #153 | Good 84.5% |
| Iranians | 69.4 /100 | #154 | Good 84.5% |
| Immigrants | Switzerland | 65.9 /100 | #155 | Good 84.5% |
| Immigrants | Israel | 64.3 /100 | #156 | Good 84.4% |
| Immigrants | Austria | 63.8 /100 | #157 | Good 84.4% |
| Jamaicans | 62.7 /100 | #158 | Good 84.4% |
| Immigrants | Senegal | 60.4 /100 | #159 | Good 84.4% |
| Immigrants | Kazakhstan | 60.4 /100 | #160 | Good 84.4% |
| Immigrants | Venezuela | 60.0 /100 | #161 | Good 84.4% |
| Immigrants | Hungary | 59.4 /100 | #162 | Average 84.4% |
| Aleuts | 59.1 /100 | #163 | Average 84.4% |
| Nigerians | 58.9 /100 | #164 | Average 84.4% |
| Venezuelans | 58.1 /100 | #165 | Average 84.4% |