Immigrants from Kuwait vs Immigrants from Turkey In Labor Force | Age 35-44

COMPARE

Immigrants from Kuwait
Race
Ancestry
AfghanAfricanAlaska NativeAlaskan AthabascanAlbanianAleutAlsatianAmericanApacheArabArapahoArgentineanArmenianAssyrian/Chaldean/SyriacAustralianAustrianBahamianBangladeshiBarbadianBasqueBelgianBelizeanBermudanBhutaneseBlackfeetBolivianBrazilianBritishBritish West IndianBulgarianBurmeseCajunCambodianCanadianCape VerdeanCarpatho RusynCelticCentral AmericanCentral American IndianCherokeeCheyenneChickasawChileanChineseChippewaChoctawColombianColvilleComancheCosta RicanCreeCreekCroatianCrowCubanCypriotCzechCzechoslovakianDanishDelawareDominicanDutchDutch West IndianEastern EuropeanEcuadorianEgyptianEnglishEstonianEthiopianEuropeanFijianFilipinoFinnishFrenchFrench American IndianFrench CanadianGermanGerman RussianGhanaianGreekGuamanian/ChamorroGuatemalanGuyaneseHaitianHmongHonduranHopiHoumaHungarianIcelanderIndian (Asian)IndonesianInupiatIranianIraqiIrishIroquoisIsraeliItalianJamaicanJapaneseJordanianKenyanKiowaKoreanLaotianLatvianLebaneseLiberianLithuanianLumbeeLuxembourgerMacedonianMalaysianMalteseMarshalleseMenomineeMexicanMexican American IndianMongolianMoroccanNative HawaiianNavajoNepaleseNew ZealanderNicaraguanNigerianNorthern EuropeanNorwegianOkinawanOsageOttawaPaiutePakistaniPalestinianPanamanianParaguayanPennsylvania GermanPeruvianPimaPolishPortuguesePotawatomiPuebloPuerto RicanPuget Sound SalishRomanianRussianSalvadoranSamoanScandinavianScotch-IrishScottishSeminoleSenegaleseSerbianShoshoneSierra LeoneanSiouxSlavicSlovakSloveneSomaliSouth AfricanSouth AmericanSouth American IndianSoviet UnionSpaniardSpanishSpanish AmericanSpanish American IndianSri LankanSubsaharan AfricanSudaneseSwedishSwissSyrianTaiwaneseThaiTlingit-HaidaTohono O'OdhamTonganTrinidadian and TobagonianTsimshianTurkishU.S. Virgin IslanderUgandanUkrainianUruguayanUteVenezuelanVietnameseWelshWest IndianYakamaYaquiYugoslavianYumanYup'ikZimbabwean
Immigration
NonimmigrantsImmigrantsAfghanistanAfricaAlbaniaArgentinaArmeniaAsiaAustraliaAustriaBahamasBangladeshBarbadosBelarusBelgiumBelizeBoliviaBosnia and HerzegovinaBrazilBulgariaBurma/MyanmarCabo VerdeCambodiaCameroonCanadaCaribbeanCentral AmericaChileChinaColombiaCongoCosta RicaCroatiaCubaCzechoslovakiaDenmarkDominicaDominican RepublicEastern AfricaEastern AsiaEastern EuropeEcuadorEgyptEl SalvadorEnglandEritreaEthiopiaEuropeFijiFranceGermanyGhanaGreeceGrenadaGuatemalaGuyanaHaitiHondurasHong KongHungaryIndiaIndonesiaIranIraqIrelandIsraelItalyJamaicaJapanJordanKazakhstanKenyaKoreaKuwaitLaosLatin AmericaLatviaLebanonLiberiaLithuaniaMalaysiaMexicoMicronesiaMiddle AfricaMoldovaMoroccoNepalNetherlandsNicaraguaNigeriaNorth AmericaNorth MacedoniaNorthern AfricaNorthern EuropeNorwayOceaniaPakistanPanamaPeruPhilippinesPolandPortugalRomaniaRussiaSaudi ArabiaScotlandSenegalSerbiaSierra LeoneSingaporeSomaliaSouth AfricaSouth AmericaSouth Central AsiaSouth Eastern AsiaSouthern EuropeSpainSri LankaSt. Vincent and the GrenadinesSudanSwedenSwitzerlandSyriaTaiwanThailandTrinidad and TobagoUgandaUkraineUruguayUzbekistanVenezuelaVietnamWest IndiesWestern AfricaWestern AsiaWestern EuropeYemenZaireZimbabweAzores
Immigrants from Turkey
Race
Ancestry
AfghanAfricanAlaska NativeAlaskan AthabascanAlbanianAleutAlsatianAmericanApacheArabArapahoArgentineanArmenianAssyrian/Chaldean/SyriacAustralianAustrianBahamianBangladeshiBarbadianBasqueBelgianBelizeanBermudanBhutaneseBlackfeetBolivianBrazilianBritishBritish West IndianBulgarianBurmeseCajunCambodianCanadianCape VerdeanCarpatho RusynCelticCentral AmericanCentral American IndianCherokeeCheyenneChickasawChileanChineseChippewaChoctawColombianColvilleComancheCosta RicanCreeCreekCroatianCrowCubanCypriotCzechCzechoslovakianDanishDelawareDominicanDutchDutch West IndianEastern EuropeanEcuadorianEgyptianEnglishEstonianEthiopianEuropeanFijianFilipinoFinnishFrenchFrench American IndianFrench CanadianGermanGerman RussianGhanaianGreekGuamanian/ChamorroGuatemalanGuyaneseHaitianHmongHonduranHopiHoumaHungarianIcelanderIndian (Asian)IndonesianInupiatIranianIraqiIrishIroquoisIsraeliItalianJamaicanJapaneseJordanianKenyanKiowaKoreanLaotianLatvianLebaneseLiberianLithuanianLumbeeLuxembourgerMacedonianMalaysianMalteseMarshalleseMenomineeMexicanMexican American IndianMongolianMoroccanNative HawaiianNavajoNepaleseNew ZealanderNicaraguanNigerianNorthern EuropeanNorwegianOkinawanOsageOttawaPaiutePakistaniPalestinianPanamanianParaguayanPennsylvania GermanPeruvianPimaPolishPortuguesePotawatomiPuebloPuerto RicanPuget Sound SalishRomanianRussianSalvadoranSamoanScandinavianScotch-IrishScottishSeminoleSenegaleseSerbianShoshoneSierra LeoneanSiouxSlavicSlovakSloveneSomaliSouth AfricanSouth AmericanSouth American IndianSoviet UnionSpaniardSpanishSpanish AmericanSpanish American IndianSri LankanSubsaharan AfricanSudaneseSwedishSwissSyrianTaiwaneseThaiTlingit-HaidaTohono O'OdhamTonganTrinidadian and TobagonianTsimshianTurkishU.S. Virgin IslanderUgandanUkrainianUruguayanUteVenezuelanVietnameseWelshWest IndianYakamaYaquiYugoslavianYumanYup'ikZimbabwean
Immigration
NonimmigrantsImmigrantsAfghanistanAfricaAlbaniaArgentinaArmeniaAsiaAustraliaAustriaBahamasBangladeshBarbadosBelarusBelgiumBelizeBoliviaBosnia and HerzegovinaBrazilBulgariaBurma/MyanmarCabo VerdeCambodiaCameroonCanadaCaribbeanCentral AmericaChileChinaColombiaCongoCosta RicaCroatiaCubaCzechoslovakiaDenmarkDominicaDominican RepublicEastern AfricaEastern AsiaEastern EuropeEcuadorEgyptEl SalvadorEnglandEritreaEthiopiaEuropeFijiFranceGermanyGhanaGreeceGrenadaGuatemalaGuyanaHaitiHondurasHong KongHungaryIndiaIndonesiaIranIraqIrelandIsraelItalyJamaicaJapanJordanKazakhstanKenyaKoreaLaosLatin AmericaLatviaLebanonLiberiaLithuaniaMalaysiaMexicoMicronesiaMiddle AfricaMoldovaMoroccoNepalNetherlandsNicaraguaNigeriaNorth AmericaNorth MacedoniaNorthern AfricaNorthern EuropeNorwayOceaniaPakistanPanamaPeruPhilippinesPolandPortugalRomaniaRussiaSaudi ArabiaScotlandSenegalSerbiaSierra LeoneSingaporeSomaliaSouth AfricaSouth AmericaSouth Central AsiaSouth Eastern AsiaSouthern EuropeSpainSri LankaSt. Vincent and the GrenadinesSudanSwedenSwitzerlandSyriaTaiwanThailandTrinidad and TobagoTurkeyUgandaUkraineUruguayUzbekistanVenezuelaVietnamWest IndiesWestern AfricaWestern AsiaWestern EuropeYemenZaireZimbabweAzores
In Labor Force | Age 35-44
Income
Poverty
Unemployment
Labor Participation
Family Structure
Vehicle Availability
Education Level
Disability

In Labor Force | Age 35-44 Comparison

Immigrants from Kuwait

Immigrants from Turkey

Exceptional
Exceptional
84.8%
IN LABOR FORCE | AGE 35-44
96.7/ 100
METRIC RATING
95th/ 347
METRIC RANK
84.9%
IN LABOR FORCE | AGE 35-44
98.6/ 100
METRIC RATING
77th/ 347
METRIC RANK

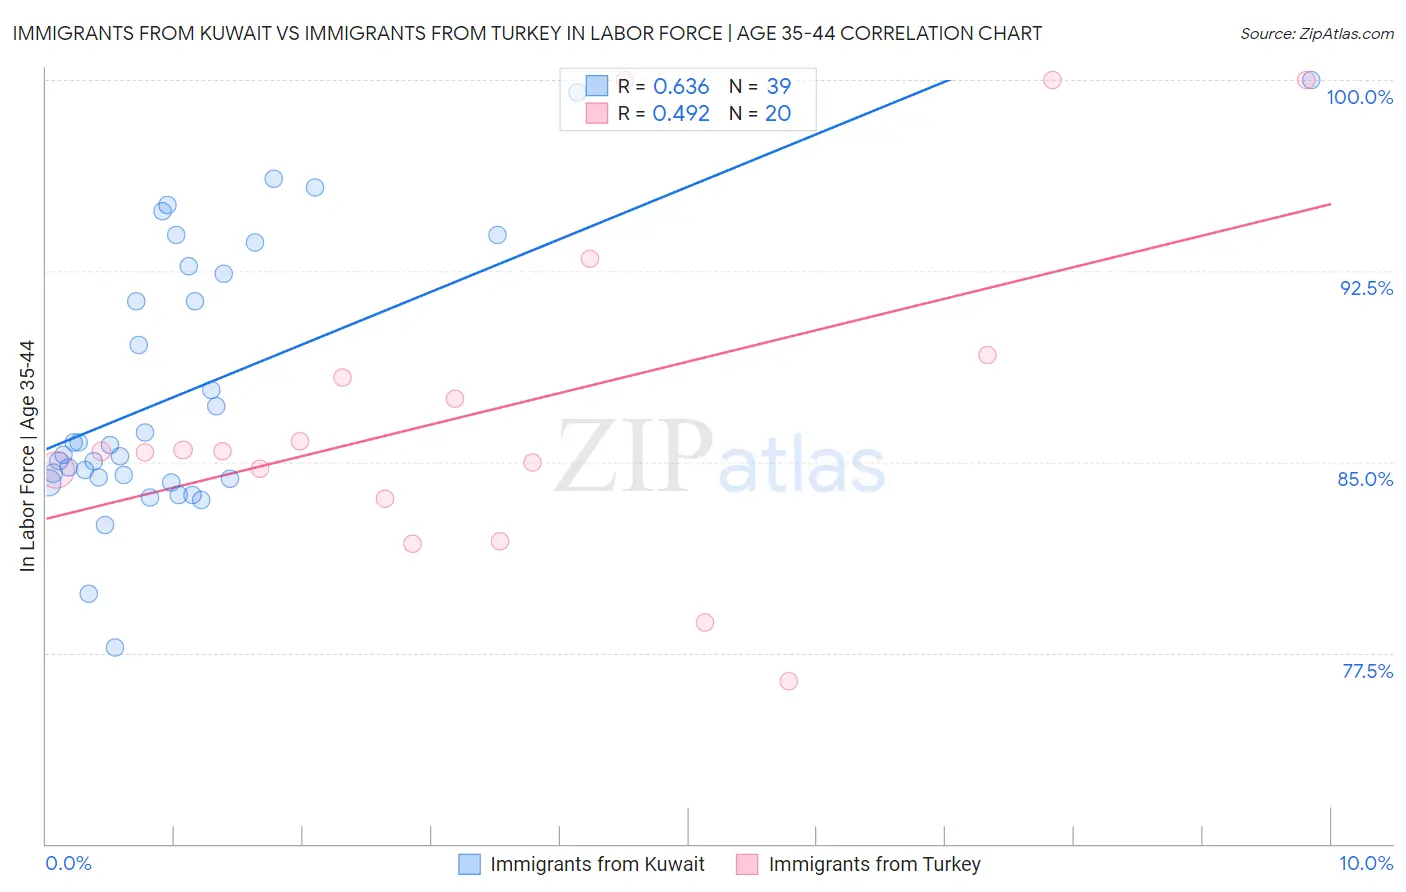
Immigrants from Kuwait vs Immigrants from Turkey In Labor Force | Age 35-44 Correlation Chart

The statistical analysis conducted on geographies consisting of 136,880,462 people shows a significant positive correlation between the proportion of Immigrants from Kuwait and labor force participation rate among population between the ages 35 and 44 in the United States with a correlation coefficient (R) of 0.636 and weighted average of 84.8%. Similarly, the statistical analysis conducted on geographies consisting of 222,985,945 people shows a moderate positive correlation between the proportion of Immigrants from Turkey and labor force participation rate among population between the ages 35 and 44 in the United States with a correlation coefficient (R) of 0.492 and weighted average of 84.9%, a difference of 0.14%.
Immigrants from Kuwait vs Immigrants from Turkey In Labor Force | Age 35-44

In Labor Force | Age 35-44 Correlation Summary

MeasurementImmigrants from KuwaitImmigrants from Turkey
Minimum77.7%76.4%
Maximum100.0%100.0%
Range22.3%23.6%
Mean87.9%87.1%
Median85.6%85.4%
Interquartile 25% (IQ1)84.4%84.1%
Interquartile 75% (IQ3)92.7%88.8%
Interquartile Range (IQR)8.3%4.7%
Standard Deviation (Sample)5.4%6.6%
Standard Deviation (Population)5.3%6.4%

Demographics Similar to Immigrants from Kuwait and Immigrants from Turkey by In Labor Force | Age 35-44

In terms of in labor force | age 35-44, the demographic groups most similar to Immigrants from Kuwait are Cuban (84.8%, a difference of 0.0%), Mongolian (84.8%, a difference of 0.010%), Immigrants from Northern Africa (84.8%, a difference of 0.020%), Immigrants from Europe (84.9%, a difference of 0.030%), and Ghanaian (84.8%, a difference of 0.030%). Similarly, the demographic groups most similar to Immigrants from Turkey are Immigrants from Cuba (84.9%, a difference of 0.0%), Immigrants from Africa (84.9%, a difference of 0.030%), Peruvian (84.9%, a difference of 0.030%), Immigrants from Colombia (84.9%, a difference of 0.030%), and Immigrants from Eastern Europe (84.9%, a difference of 0.030%).
DemographicsRating | RankIn Labor Force | Age 35-44
Immigrants | Cuba
98.6
/100
|
#76
Exceptional
84.9%
Immigrants | Turkey
98.6
/100
|
#77
Exceptional
84.9%
Immigrants | Africa
98.4
/100
|
#78
Exceptional
84.9%
Peruvians
98.3
/100
|
#79
Exceptional
84.9%
Immigrants | Colombia
98.3
/100
|
#80
Exceptional
84.9%
Immigrants | Eastern Europe
98.3
/100
|
#81
Exceptional
84.9%
Immigrants | Sudan
98.1
/100
|
#82
Exceptional
84.9%
Senegalese
97.8
/100
|
#83
Exceptional
84.9%
Immigrants | Peru
97.8
/100
|
#84
Exceptional
84.9%
Immigrants | Middle Africa
97.8
/100
|
#85
Exceptional
84.9%
Greeks
97.8
/100
|
#86
Exceptional
84.9%
Belgians
97.7
/100
|
#87
Exceptional
84.9%
Yugoslavians
97.7
/100
|
#88
Exceptional
84.9%
Immigrants | Pakistan
97.5
/100
|
#89
Exceptional
84.9%
Immigrants | France
97.4
/100
|
#90
Exceptional
84.9%
Immigrants | Europe
97.2
/100
|
#91
Exceptional
84.9%
Ghanaians
97.2
/100
|
#92
Exceptional
84.8%
Immigrants | Northern Africa
97.1
/100
|
#93
Exceptional
84.8%
Mongolians
96.8
/100
|
#94
Exceptional
84.8%
Immigrants | Kuwait
96.7
/100
|
#95
Exceptional
84.8%
Cubans
96.6
/100
|
#96
Exceptional
84.8%