Immigrants from Italy vs Bulgarian In Labor Force | Age 25-29
COMPARE
Immigrants from Italy
Bulgarian
In Labor Force | Age 25-29
In Labor Force | Age 25-29 Comparison
Immigrants from Italy
Bulgarians
85.4%
IN LABOR FORCE | AGE 25-29
99.3/ 100
METRIC RATING
64th/ 347
METRIC RANK
86.0%
IN LABOR FORCE | AGE 25-29
100.0/ 100
METRIC RATING
18th/ 347
METRIC RANK
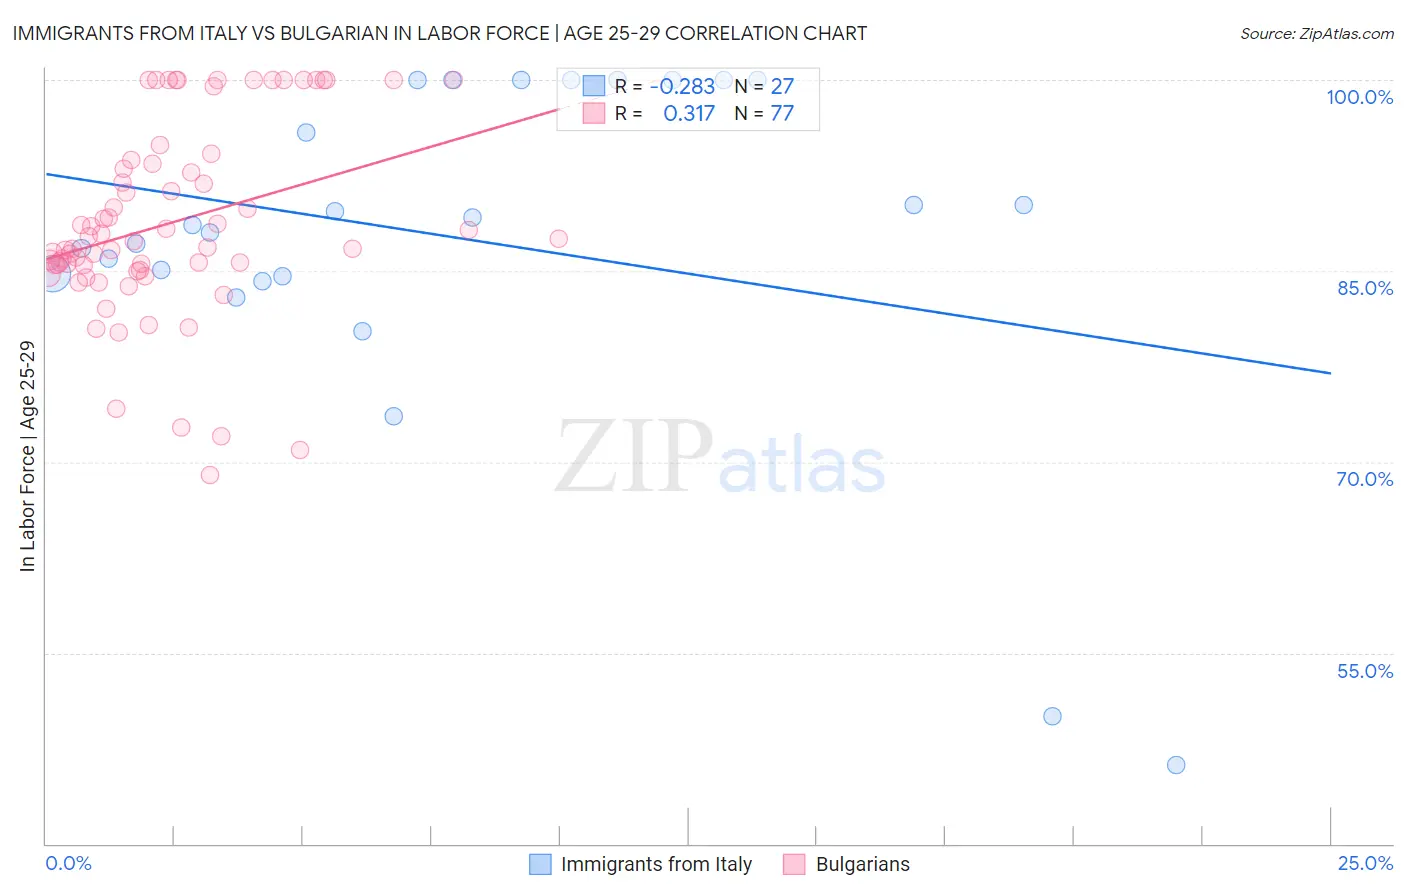
Immigrants from Italy vs Bulgarian In Labor Force | Age 25-29 Correlation Chart
The statistical analysis conducted on geographies consisting of 324,138,046 people shows a weak negative correlation between the proportion of Immigrants from Italy and labor force participation rate among population between the ages 25 and 29 in the United States with a correlation coefficient (R) of -0.283 and weighted average of 85.4%. Similarly, the statistical analysis conducted on geographies consisting of 205,601,422 people shows a mild positive correlation between the proportion of Bulgarians and labor force participation rate among population between the ages 25 and 29 in the United States with a correlation coefficient (R) of 0.317 and weighted average of 86.0%, a difference of 0.69%.
In Labor Force | Age 25-29 Correlation Summary
| Measurement | Immigrants from Italy | Bulgarian |
| Minimum | 46.2% | 69.0% |
| Maximum | 100.0% | 100.0% |
| Range | 53.8% | 31.0% |
| Mean | 87.5% | 88.8% |
| Median | 88.6% | 87.3% |
| Interquartile 25% (IQ1) | 84.6% | 85.3% |
| Interquartile 75% (IQ3) | 100.0% | 93.6% |
| Interquartile Range (IQR) | 15.4% | 8.3% |
| Standard Deviation (Sample) | 13.5% | 7.5% |
| Standard Deviation (Population) | 13.3% | 7.5% |
Similar Demographics by In Labor Force | Age 25-29
Demographics Similar to Immigrants from Italy by In Labor Force | Age 25-29
In terms of in labor force | age 25-29, the demographic groups most similar to Immigrants from Italy are Immigrants from Czechoslovakia (85.4%, a difference of 0.010%), Immigrants from Scotland (85.4%, a difference of 0.010%), Immigrants from Kenya (85.4%, a difference of 0.020%), Immigrants from Turkey (85.4%, a difference of 0.020%), and Taiwanese (85.4%, a difference of 0.030%).
| Demographics | Rating | Rank | In Labor Force | Age 25-29 |
| Estonians | 99.6 /100 | #57 | Exceptional 85.5% |
| Greeks | 99.6 /100 | #58 | Exceptional 85.5% |
| Immigrants | Morocco | 99.5 /100 | #59 | Exceptional 85.5% |
| Thais | 99.5 /100 | #60 | Exceptional 85.5% |
| Serbians | 99.5 /100 | #61 | Exceptional 85.5% |
| Taiwanese | 99.4 /100 | #62 | Exceptional 85.4% |
| Immigrants | Kenya | 99.4 /100 | #63 | Exceptional 85.4% |
| Immigrants | Italy | 99.3 /100 | #64 | Exceptional 85.4% |
| Immigrants | Czechoslovakia | 99.3 /100 | #65 | Exceptional 85.4% |
| Immigrants | Scotland | 99.3 /100 | #66 | Exceptional 85.4% |
| Immigrants | Turkey | 99.2 /100 | #67 | Exceptional 85.4% |
| Immigrants | Cameroon | 99.2 /100 | #68 | Exceptional 85.4% |
| Menominee | 99.1 /100 | #69 | Exceptional 85.4% |
| Immigrants | Sweden | 99.1 /100 | #70 | Exceptional 85.4% |
| Kenyans | 99.0 /100 | #71 | Exceptional 85.4% |
Demographics Similar to Bulgarians by In Labor Force | Age 25-29
In terms of in labor force | age 25-29, the demographic groups most similar to Bulgarians are Cape Verdean (86.0%, a difference of 0.010%), Immigrants from Ireland (86.0%, a difference of 0.020%), Bermudan (86.0%, a difference of 0.030%), Maltese (86.0%, a difference of 0.030%), and Cambodian (86.0%, a difference of 0.040%).
| Demographics | Rating | Rank | In Labor Force | Age 25-29 |
| Immigrants | Ethiopia | 100.0 /100 | #11 | Exceptional 86.1% |
| Immigrants | Lithuania | 100.0 /100 | #12 | Exceptional 86.1% |
| Norwegians | 100.0 /100 | #13 | Exceptional 86.1% |
| Latvians | 100.0 /100 | #14 | Exceptional 86.1% |
| Bolivians | 100.0 /100 | #15 | Exceptional 86.1% |
| Immigrants | Bolivia | 100.0 /100 | #16 | Exceptional 86.1% |
| Bermudans | 100.0 /100 | #17 | Exceptional 86.0% |
| Bulgarians | 100.0 /100 | #18 | Exceptional 86.0% |
| Cape Verdeans | 100.0 /100 | #19 | Exceptional 86.0% |
| Immigrants | Ireland | 100.0 /100 | #20 | Exceptional 86.0% |
| Maltese | 100.0 /100 | #21 | Exceptional 86.0% |
| Cambodians | 100.0 /100 | #22 | Exceptional 86.0% |
| Immigrants | Uganda | 100.0 /100 | #23 | Exceptional 86.0% |
| Immigrants | Eastern Africa | 100.0 /100 | #24 | Exceptional 86.0% |
| Sudanese | 100.0 /100 | #25 | Exceptional 85.9% |