Immigrants from Israel vs Immigrants from Hungary In Labor Force | Age 20-64
COMPARE
Immigrants from Israel
Immigrants from Hungary
In Labor Force | Age 20-64
In Labor Force | Age 20-64 Comparison
Immigrants from Israel
Immigrants from Hungary
79.8%
IN LABOR FORCE | AGE 20-64
80.0/ 100
METRIC RATING
141st/ 347
METRIC RANK
79.5%
IN LABOR FORCE | AGE 20-64
36.8/ 100
METRIC RATING
183rd/ 347
METRIC RANK
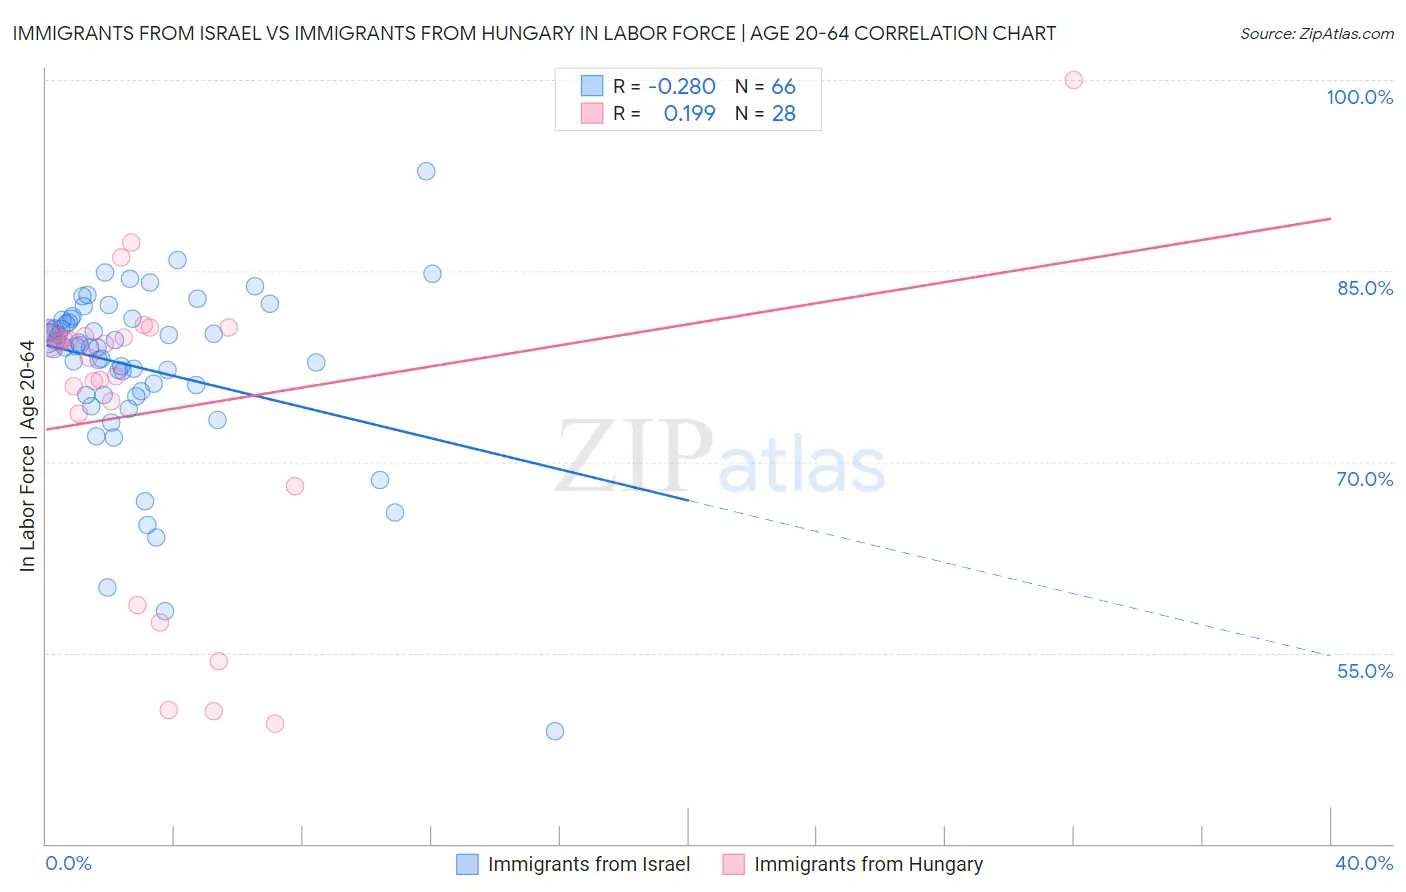
Immigrants from Israel vs Immigrants from Hungary In Labor Force | Age 20-64 Correlation Chart
The statistical analysis conducted on geographies consisting of 210,029,528 people shows a weak negative correlation between the proportion of Immigrants from Israel and labor force participation rate among population between the ages 20 and 64 in the United States with a correlation coefficient (R) of -0.280 and weighted average of 79.8%. Similarly, the statistical analysis conducted on geographies consisting of 195,708,395 people shows a poor positive correlation between the proportion of Immigrants from Hungary and labor force participation rate among population between the ages 20 and 64 in the United States with a correlation coefficient (R) of 0.199 and weighted average of 79.5%, a difference of 0.39%.
In Labor Force | Age 20-64 Correlation Summary
| Measurement | Immigrants from Israel | Immigrants from Hungary |
| Minimum | 48.8% | 49.4% |
| Maximum | 92.8% | 100.0% |
| Range | 44.0% | 50.6% |
| Mean | 77.4% | 74.1% |
| Median | 79.1% | 78.7% |
| Interquartile 25% (IQ1) | 75.3% | 70.9% |
| Interquartile 75% (IQ3) | 81.2% | 79.9% |
| Interquartile Range (IQR) | 5.9% | 9.0% |
| Standard Deviation (Sample) | 7.0% | 12.3% |
| Standard Deviation (Population) | 6.9% | 12.1% |
Similar Demographics by In Labor Force | Age 20-64
Demographics Similar to Immigrants from Israel by In Labor Force | Age 20-64
In terms of in labor force | age 20-64, the demographic groups most similar to Immigrants from Israel are Immigrants from South Eastern Asia (79.8%, a difference of 0.0%), Slovak (79.8%, a difference of 0.0%), Immigrants from Sweden (79.8%, a difference of 0.0%), Korean (79.8%, a difference of 0.0%), and Pakistani (79.8%, a difference of 0.010%).
| Demographics | Rating | Rank | In Labor Force | Age 20-64 |
| Belgians | 87.4 /100 | #134 | Excellent 79.9% |
| Ukrainians | 86.8 /100 | #135 | Excellent 79.9% |
| Immigrants | Singapore | 86.7 /100 | #136 | Excellent 79.9% |
| Immigrants | Ukraine | 86.5 /100 | #137 | Excellent 79.9% |
| Immigrants | Nigeria | 86.4 /100 | #138 | Excellent 79.9% |
| Immigrants | Spain | 83.9 /100 | #139 | Excellent 79.8% |
| Immigrants | South Eastern Asia | 80.4 /100 | #140 | Excellent 79.8% |
| Immigrants | Israel | 80.0 /100 | #141 | Good 79.8% |
| Slovaks | 79.9 /100 | #142 | Good 79.8% |
| Immigrants | Sweden | 79.7 /100 | #143 | Good 79.8% |
| Koreans | 79.6 /100 | #144 | Good 79.8% |
| Pakistanis | 79.3 /100 | #145 | Good 79.8% |
| Immigrants | Southern Europe | 78.9 /100 | #146 | Good 79.8% |
| Immigrants | Philippines | 78.0 /100 | #147 | Good 79.8% |
| Romanians | 77.6 /100 | #148 | Good 79.8% |
Demographics Similar to Immigrants from Hungary by In Labor Force | Age 20-64
In terms of in labor force | age 20-64, the demographic groups most similar to Immigrants from Hungary are Malaysian (79.5%, a difference of 0.0%), Immigrants from Saudi Arabia (79.5%, a difference of 0.010%), Finnish (79.5%, a difference of 0.010%), Israeli (79.5%, a difference of 0.020%), and Northern European (79.5%, a difference of 0.020%).
| Demographics | Rating | Rank | In Labor Force | Age 20-64 |
| Australians | 46.0 /100 | #176 | Average 79.5% |
| Immigrants | Netherlands | 45.2 /100 | #177 | Average 79.5% |
| Czechoslovakians | 44.3 /100 | #178 | Average 79.5% |
| Armenians | 41.4 /100 | #179 | Average 79.5% |
| Salvadorans | 41.0 /100 | #180 | Average 79.5% |
| Immigrants | Saudi Arabia | 37.7 /100 | #181 | Fair 79.5% |
| Malaysians | 37.1 /100 | #182 | Fair 79.5% |
| Immigrants | Hungary | 36.8 /100 | #183 | Fair 79.5% |
| Finns | 35.9 /100 | #184 | Fair 79.5% |
| Israelis | 34.7 /100 | #185 | Fair 79.5% |
| Northern Europeans | 34.5 /100 | #186 | Fair 79.5% |
| Assyrians/Chaldeans/Syriacs | 33.3 /100 | #187 | Fair 79.4% |
| Immigrants | Haiti | 32.1 /100 | #188 | Fair 79.4% |
| Immigrants | El Salvador | 30.9 /100 | #189 | Fair 79.4% |
| Immigrants | Syria | 30.8 /100 | #190 | Fair 79.4% |