Immigrants from Ireland vs Sierra Leonean In Labor Force | Age 25-29

COMPARE

Immigrants from Ireland
Race
Ancestry
AfghanAfricanAlaska NativeAlaskan AthabascanAlbanianAleutAlsatianAmericanApacheArabArapahoArgentineanArmenianAssyrian/Chaldean/SyriacAustralianAustrianBahamianBangladeshiBarbadianBasqueBelgianBelizeanBermudanBhutaneseBlackfeetBolivianBrazilianBritishBritish West IndianBulgarianBurmeseCajunCambodianCanadianCape VerdeanCarpatho RusynCelticCentral AmericanCentral American IndianCherokeeCheyenneChickasawChileanChineseChippewaChoctawColombianColvilleComancheCosta RicanCreeCreekCroatianCrowCubanCypriotCzechCzechoslovakianDanishDelawareDominicanDutchDutch West IndianEastern EuropeanEcuadorianEgyptianEnglishEstonianEthiopianEuropeanFijianFilipinoFinnishFrenchFrench American IndianFrench CanadianGermanGerman RussianGhanaianGreekGuamanian/ChamorroGuatemalanGuyaneseHaitianHmongHonduranHopiHoumaHungarianIcelanderIndian (Asian)IndonesianInupiatIranianIraqiIrishIroquoisIsraeliItalianJamaicanJapaneseJordanianKenyanKiowaKoreanLaotianLatvianLebaneseLiberianLithuanianLumbeeLuxembourgerMacedonianMalaysianMalteseMarshalleseMenomineeMexicanMexican American IndianMongolianMoroccanNative HawaiianNavajoNepaleseNew ZealanderNicaraguanNigerianNorthern EuropeanNorwegianOkinawanOsageOttawaPaiutePakistaniPalestinianPanamanianParaguayanPennsylvania GermanPeruvianPimaPolishPortuguesePotawatomiPuebloPuerto RicanPuget Sound SalishRomanianRussianSalvadoranSamoanScandinavianScotch-IrishScottishSeminoleSenegaleseSerbianShoshoneSiouxSlavicSlovakSloveneSomaliSouth AfricanSouth AmericanSouth American IndianSoviet UnionSpaniardSpanishSpanish AmericanSpanish American IndianSri LankanSubsaharan AfricanSudaneseSwedishSwissSyrianTaiwaneseThaiTlingit-HaidaTohono O'OdhamTonganTrinidadian and TobagonianTsimshianTurkishU.S. Virgin IslanderUgandanUkrainianUruguayanUteVenezuelanVietnameseWelshWest IndianYakamaYaquiYugoslavianYumanYup'ikZimbabwean
Immigration
NonimmigrantsImmigrantsAfghanistanAfricaAlbaniaArgentinaArmeniaAsiaAustraliaAustriaBahamasBangladeshBarbadosBelarusBelgiumBelizeBoliviaBosnia and HerzegovinaBrazilBulgariaBurma/MyanmarCabo VerdeCambodiaCameroonCanadaCaribbeanCentral AmericaChileChinaColombiaCongoCosta RicaCroatiaCubaCzechoslovakiaDenmarkDominicaDominican RepublicEastern AfricaEastern AsiaEastern EuropeEcuadorEgyptEl SalvadorEnglandEritreaEthiopiaEuropeFijiFranceGermanyGhanaGreeceGrenadaGuatemalaGuyanaHaitiHondurasHong KongHungaryIndiaIndonesiaIranIraqIrelandIsraelItalyJamaicaJapanJordanKazakhstanKenyaKoreaKuwaitLaosLatin AmericaLatviaLebanonLiberiaLithuaniaMalaysiaMexicoMicronesiaMiddle AfricaMoldovaMoroccoNepalNetherlandsNicaraguaNigeriaNorth AmericaNorth MacedoniaNorthern AfricaNorthern EuropeNorwayOceaniaPakistanPanamaPeruPhilippinesPolandPortugalRomaniaRussiaSaudi ArabiaScotlandSenegalSerbiaSierra LeoneSingaporeSomaliaSouth AfricaSouth AmericaSouth Central AsiaSouth Eastern AsiaSouthern EuropeSpainSri LankaSt. Vincent and the GrenadinesSudanSwedenSwitzerlandSyriaTaiwanThailandTrinidad and TobagoTurkeyUgandaUkraineUruguayUzbekistanVenezuelaVietnamWest IndiesWestern AfricaWestern AsiaWestern EuropeYemenZaireZimbabweAzores
Sierra Leonean
Race
Ancestry
AfghanAfricanAlaska NativeAlaskan AthabascanAlbanianAleutAlsatianAmericanApacheArabArapahoArgentineanArmenianAssyrian/Chaldean/SyriacAustralianAustrianBahamianBangladeshiBarbadianBasqueBelgianBelizeanBermudanBhutaneseBlackfeetBolivianBrazilianBritishBritish West IndianBulgarianBurmeseCajunCambodianCanadianCape VerdeanCarpatho RusynCelticCentral AmericanCentral American IndianCherokeeCheyenneChickasawChileanChineseChippewaChoctawColombianColvilleComancheCosta RicanCreeCreekCroatianCrowCubanCypriotCzechCzechoslovakianDanishDelawareDominicanDutchDutch West IndianEastern EuropeanEcuadorianEgyptianEnglishEstonianEthiopianEuropeanFijianFilipinoFinnishFrenchFrench American IndianFrench CanadianGermanGerman RussianGhanaianGreekGuamanian/ChamorroGuatemalanGuyaneseHaitianHmongHonduranHopiHoumaHungarianIcelanderIndian (Asian)IndonesianInupiatIranianIraqiIrishIroquoisIsraeliItalianJamaicanJapaneseJordanianKenyanKiowaKoreanLaotianLatvianLebaneseLiberianLithuanianLumbeeLuxembourgerMacedonianMalaysianMalteseMarshalleseMenomineeMexicanMexican American IndianMongolianMoroccanNative HawaiianNavajoNepaleseNew ZealanderNicaraguanNigerianNorthern EuropeanNorwegianOkinawanOsageOttawaPaiutePakistaniPalestinianPanamanianParaguayanPennsylvania GermanPeruvianPimaPolishPortuguesePotawatomiPuebloPuerto RicanPuget Sound SalishRomanianRussianSalvadoranSamoanScandinavianScotch-IrishScottishSeminoleSenegaleseSerbianShoshoneSierra LeoneanSiouxSlavicSlovakSloveneSomaliSouth AfricanSouth AmericanSouth American IndianSoviet UnionSpaniardSpanishSpanish AmericanSpanish American IndianSri LankanSubsaharan AfricanSudaneseSwedishSwissSyrianTaiwaneseThaiTlingit-HaidaTohono O'OdhamTonganTrinidadian and TobagonianTsimshianTurkishU.S. Virgin IslanderUgandanUkrainianUruguayanUteVenezuelanVietnameseWelshWest IndianYakamaYaquiYugoslavianYumanYup'ikZimbabwean
Immigration
NonimmigrantsImmigrantsAfghanistanAfricaAlbaniaArgentinaArmeniaAsiaAustraliaAustriaBahamasBangladeshBarbadosBelarusBelgiumBelizeBoliviaBosnia and HerzegovinaBrazilBulgariaBurma/MyanmarCabo VerdeCambodiaCameroonCanadaCaribbeanCentral AmericaChileChinaColombiaCongoCosta RicaCroatiaCubaCzechoslovakiaDenmarkDominicaDominican RepublicEastern AfricaEastern AsiaEastern EuropeEcuadorEgyptEl SalvadorEnglandEritreaEthiopiaEuropeFijiFranceGermanyGhanaGreeceGrenadaGuatemalaGuyanaHaitiHondurasHong KongHungaryIndiaIndonesiaIranIraqIsraelItalyJamaicaJapanJordanKazakhstanKenyaKoreaKuwaitLaosLatin AmericaLatviaLebanonLiberiaLithuaniaMalaysiaMexicoMicronesiaMiddle AfricaMoldovaMoroccoNepalNetherlandsNicaraguaNigeriaNorth AmericaNorth MacedoniaNorthern AfricaNorthern EuropeNorwayOceaniaPakistanPanamaPeruPhilippinesPolandPortugalRomaniaRussiaSaudi ArabiaScotlandSenegalSerbiaSierra LeoneSingaporeSomaliaSouth AfricaSouth AmericaSouth Central AsiaSouth Eastern AsiaSouthern EuropeSpainSri LankaSt. Vincent and the GrenadinesSudanSwedenSwitzerlandSyriaTaiwanThailandTrinidad and TobagoTurkeyUgandaUkraineUruguayUzbekistanVenezuelaVietnamWest IndiesWestern AfricaWestern AsiaWestern EuropeYemenZaireZimbabweAzores
In Labor Force | Age 25-29
Income
Poverty
Unemployment
Labor Participation
Family Structure
Vehicle Availability
Education Level
Disability

In Labor Force | Age 25-29 Comparison

Immigrants from Ireland

Sierra Leoneans

Exceptional
Exceptional
86.0%
IN LABOR FORCE | AGE 25-29
100.0/ 100
METRIC RATING
20th/ 347
METRIC RANK
85.8%
IN LABOR FORCE | AGE 25-29
99.9/ 100
METRIC RATING
38th/ 347
METRIC RANK

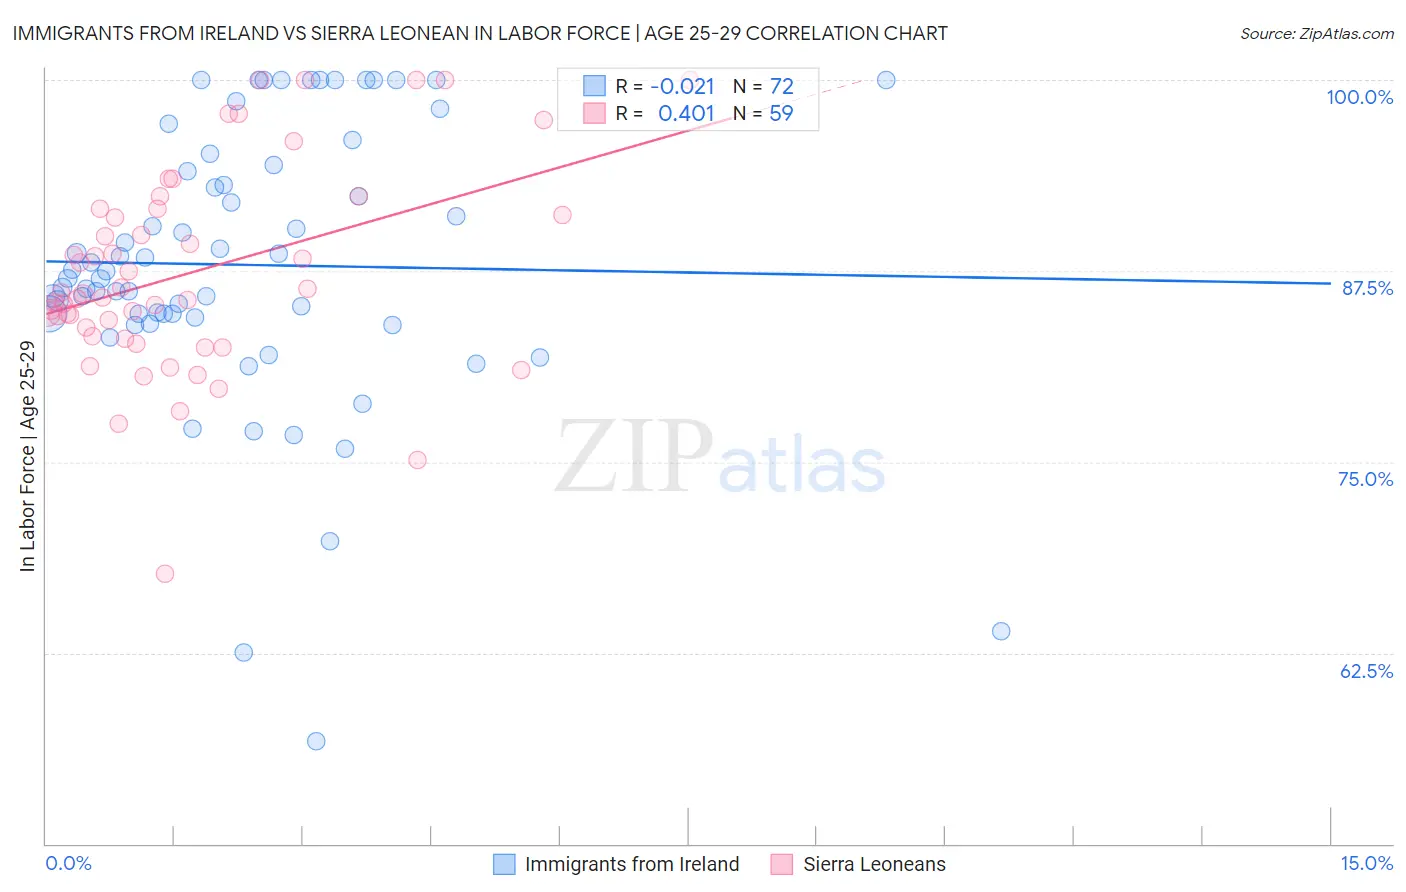
Immigrants from Ireland vs Sierra Leonean In Labor Force | Age 25-29 Correlation Chart

The statistical analysis conducted on geographies consisting of 240,731,363 people shows no correlation between the proportion of Immigrants from Ireland and labor force participation rate among population between the ages 25 and 29 in the United States with a correlation coefficient (R) of -0.021 and weighted average of 86.0%. Similarly, the statistical analysis conducted on geographies consisting of 83,354,456 people shows a moderate positive correlation between the proportion of Sierra Leoneans and labor force participation rate among population between the ages 25 and 29 in the United States with a correlation coefficient (R) of 0.401 and weighted average of 85.8%, a difference of 0.28%.
Immigrants from Ireland vs Sierra Leonean In Labor Force | Age 25-29

In Labor Force | Age 25-29 Correlation Summary

MeasurementImmigrants from IrelandSierra Leonean
Minimum56.7%67.6%
Maximum100.0%100.0%
Range43.3%32.4%
Mean87.9%87.4%
Median87.2%86.0%
Interquartile 25% (IQ1)84.6%83.2%
Interquartile 75% (IQ3)94.2%91.6%
Interquartile Range (IQR)9.7%8.3%
Standard Deviation (Sample)9.1%6.7%
Standard Deviation (Population)9.0%6.6%

Demographics Similar to Immigrants from Ireland and Sierra Leoneans by In Labor Force | Age 25-29

In terms of in labor force | age 25-29, the demographic groups most similar to Immigrants from Ireland are Cape Verdean (86.0%, a difference of 0.010%), Maltese (86.0%, a difference of 0.010%), Cambodian (86.0%, a difference of 0.020%), Immigrants from Uganda (86.0%, a difference of 0.040%), and Immigrants from Eastern Africa (86.0%, a difference of 0.050%). Similarly, the demographic groups most similar to Sierra Leoneans are Croatian (85.8%, a difference of 0.0%), Polish (85.8%, a difference of 0.020%), Cypriot (85.8%, a difference of 0.050%), Immigrants from Nepal (85.8%, a difference of 0.050%), and Lithuanian (85.8%, a difference of 0.060%).
DemographicsRating | RankIn Labor Force | Age 25-29
Cape Verdeans
100.0
/100
|
#19
Exceptional
86.0%
Immigrants | Ireland
100.0
/100
|
#20
Exceptional
86.0%
Maltese
100.0
/100
|
#21
Exceptional
86.0%
Cambodians
100.0
/100
|
#22
Exceptional
86.0%
Immigrants | Uganda
100.0
/100
|
#23
Exceptional
86.0%
Immigrants | Eastern Africa
100.0
/100
|
#24
Exceptional
86.0%
Sudanese
100.0
/100
|
#25
Exceptional
85.9%
Immigrants | North Macedonia
100.0
/100
|
#26
Exceptional
85.9%
Paraguayans
100.0
/100
|
#27
Exceptional
85.9%
Ugandans
100.0
/100
|
#28
Exceptional
85.9%
Immigrants | Liberia
100.0
/100
|
#29
Exceptional
85.9%
Immigrants | Serbia
100.0
/100
|
#30
Exceptional
85.9%
German Russians
100.0
/100
|
#31
Exceptional
85.8%
Slovaks
100.0
/100
|
#32
Exceptional
85.8%
Immigrants | Bulgaria
100.0
/100
|
#33
Exceptional
85.8%
Lithuanians
99.9
/100
|
#34
Exceptional
85.8%
Cypriots
99.9
/100
|
#35
Exceptional
85.8%
Immigrants | Nepal
99.9
/100
|
#36
Exceptional
85.8%
Poles
99.9
/100
|
#37
Exceptional
85.8%
Sierra Leoneans
99.9
/100
|
#38
Exceptional
85.8%
Croatians
99.9
/100
|
#39
Exceptional
85.8%