Immigrants from Hungary vs Immigrants from Hong Kong In Labor Force | Age > 16
COMPARE
Immigrants from Hungary
Immigrants from Hong Kong
In Labor Force | Age > 16
In Labor Force | Age > 16 Comparison
Immigrants from Hungary
Immigrants from Hong Kong
64.5%
IN LABOR FORCE | AGE > 16
3.8/ 100
METRIC RATING
239th/ 347
METRIC RANK
65.7%
IN LABOR FORCE | AGE > 16
96.2/ 100
METRIC RATING
120th/ 347
METRIC RANK
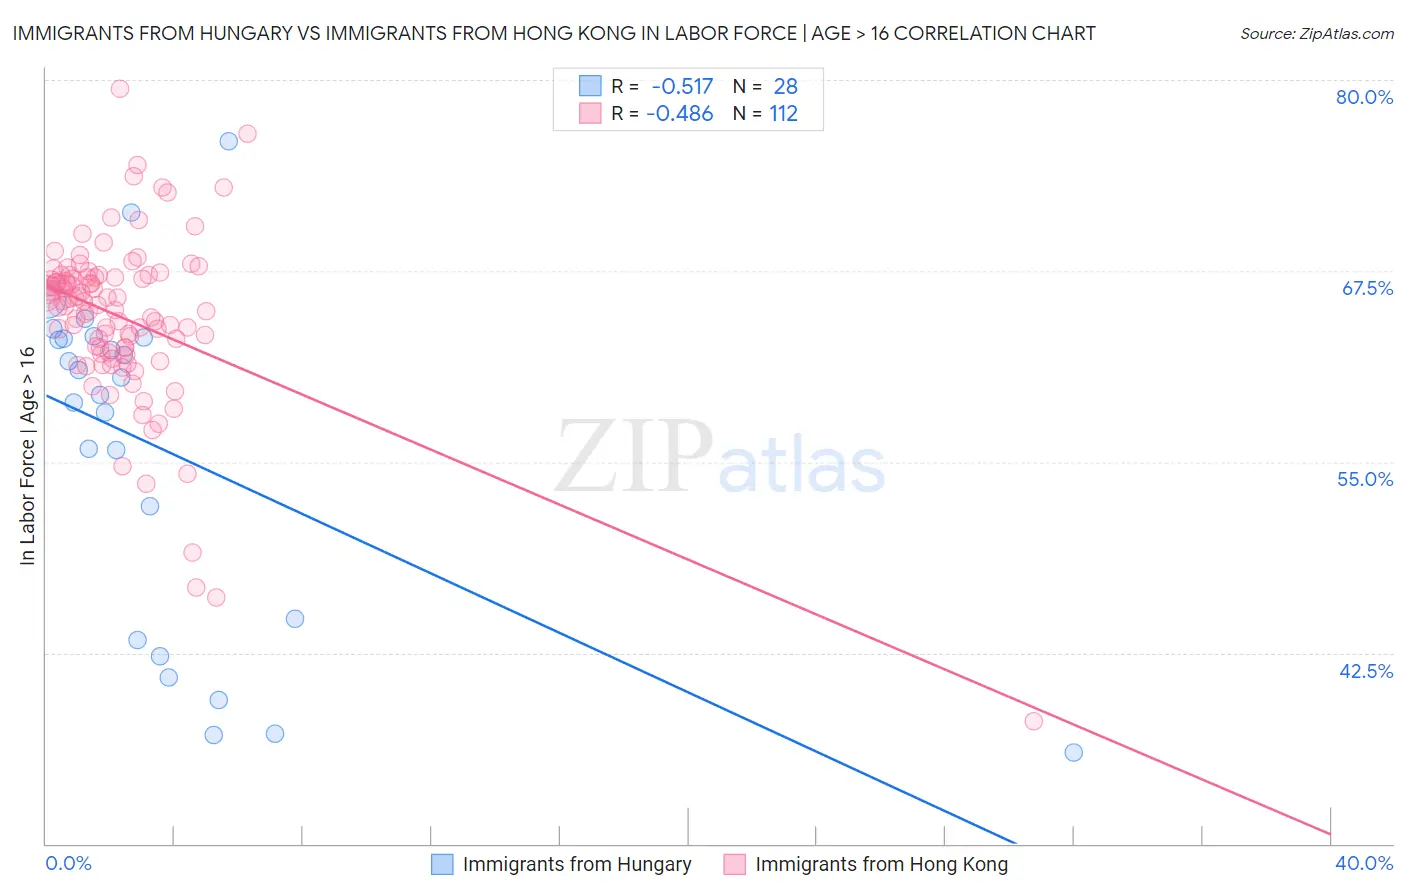
Immigrants from Hungary vs Immigrants from Hong Kong In Labor Force | Age > 16 Correlation Chart
The statistical analysis conducted on geographies consisting of 195,708,395 people shows a substantial negative correlation between the proportion of Immigrants from Hungary and labor force participation rate among population ages 16 and over in the United States with a correlation coefficient (R) of -0.517 and weighted average of 64.5%. Similarly, the statistical analysis conducted on geographies consisting of 254,003,180 people shows a moderate negative correlation between the proportion of Immigrants from Hong Kong and labor force participation rate among population ages 16 and over in the United States with a correlation coefficient (R) of -0.486 and weighted average of 65.7%, a difference of 1.8%.
In Labor Force | Age > 16 Correlation Summary
| Measurement | Immigrants from Hungary | Immigrants from Hong Kong |
| Minimum | 36.0% | 38.0% |
| Maximum | 76.0% | 79.4% |
| Range | 40.0% | 41.4% |
| Mean | 55.8% | 64.4% |
| Median | 60.0% | 65.4% |
| Interquartile 25% (IQ1) | 44.0% | 62.3% |
| Interquartile 75% (IQ3) | 63.1% | 67.1% |
| Interquartile Range (IQR) | 19.1% | 4.8% |
| Standard Deviation (Sample) | 11.1% | 5.7% |
| Standard Deviation (Population) | 10.9% | 5.6% |
Similar Demographics by In Labor Force | Age > 16
Demographics Similar to Immigrants from Hungary by In Labor Force | Age > 16
In terms of in labor force | age > 16, the demographic groups most similar to Immigrants from Hungary are Lebanese (64.5%, a difference of 0.010%), Immigrants from Bangladesh (64.5%, a difference of 0.020%), Immigrants from Dominica (64.5%, a difference of 0.020%), Immigrants from Netherlands (64.5%, a difference of 0.030%), and Immigrants from Lebanon (64.5%, a difference of 0.050%).
| Demographics | Rating | Rank | In Labor Force | Age > 16 |
| Africans | 5.8 /100 | #232 | Tragic 64.6% |
| Slavs | 4.9 /100 | #233 | Tragic 64.6% |
| Vietnamese | 4.7 /100 | #234 | Tragic 64.6% |
| Austrians | 4.6 /100 | #235 | Tragic 64.6% |
| Immigrants | Norway | 4.6 /100 | #236 | Tragic 64.6% |
| Italians | 4.6 /100 | #237 | Tragic 64.6% |
| Lebanese | 3.9 /100 | #238 | Tragic 64.5% |
| Immigrants | Hungary | 3.8 /100 | #239 | Tragic 64.5% |
| Immigrants | Bangladesh | 3.6 /100 | #240 | Tragic 64.5% |
| Immigrants | Dominica | 3.5 /100 | #241 | Tragic 64.5% |
| Immigrants | Netherlands | 3.4 /100 | #242 | Tragic 64.5% |
| Immigrants | Lebanon | 3.2 /100 | #243 | Tragic 64.5% |
| Tsimshian | 3.1 /100 | #244 | Tragic 64.5% |
| West Indians | 3.0 /100 | #245 | Tragic 64.5% |
| Immigrants | Caribbean | 2.3 /100 | #246 | Tragic 64.4% |
Demographics Similar to Immigrants from Hong Kong by In Labor Force | Age > 16
In terms of in labor force | age > 16, the demographic groups most similar to Immigrants from Hong Kong are Immigrants from France (65.7%, a difference of 0.020%), New Zealander (65.7%, a difference of 0.020%), Immigrants from Ecuador (65.7%, a difference of 0.020%), Immigrants from Iran (65.7%, a difference of 0.030%), and Immigrants from Thailand (65.7%, a difference of 0.030%).
| Demographics | Rating | Rank | In Labor Force | Age > 16 |
| Pakistanis | 97.1 /100 | #113 | Exceptional 65.8% |
| Hondurans | 97.1 /100 | #114 | Exceptional 65.8% |
| Immigrants | Indonesia | 96.8 /100 | #115 | Exceptional 65.7% |
| Argentineans | 96.7 /100 | #116 | Exceptional 65.7% |
| Immigrants | Iran | 96.6 /100 | #117 | Exceptional 65.7% |
| Immigrants | Thailand | 96.6 /100 | #118 | Exceptional 65.7% |
| Immigrants | France | 96.4 /100 | #119 | Exceptional 65.7% |
| Immigrants | Hong Kong | 96.2 /100 | #120 | Exceptional 65.7% |
| New Zealanders | 96.0 /100 | #121 | Exceptional 65.7% |
| Immigrants | Ecuador | 95.9 /100 | #122 | Exceptional 65.7% |
| Immigrants | Iraq | 95.5 /100 | #123 | Exceptional 65.7% |
| Iraqis | 95.4 /100 | #124 | Exceptional 65.7% |
| Norwegians | 95.3 /100 | #125 | Exceptional 65.7% |
| Koreans | 95.3 /100 | #126 | Exceptional 65.7% |
| Immigrants | Eastern Asia | 94.9 /100 | #127 | Exceptional 65.7% |