Immigrants from Honduras vs Iraqi In Labor Force | Age 20-64

COMPARE

Immigrants from Honduras
Race
Ancestry
AfghanAfricanAlaska NativeAlaskan AthabascanAlbanianAleutAlsatianAmericanApacheArabArapahoArgentineanArmenianAssyrian/Chaldean/SyriacAustralianAustrianBahamianBangladeshiBarbadianBasqueBelgianBelizeanBermudanBhutaneseBlackfeetBolivianBrazilianBritishBritish West IndianBulgarianBurmeseCajunCambodianCanadianCape VerdeanCarpatho RusynCelticCentral AmericanCentral American IndianCherokeeCheyenneChickasawChileanChineseChippewaChoctawColombianColvilleComancheCosta RicanCreeCreekCroatianCrowCubanCypriotCzechCzechoslovakianDanishDelawareDominicanDutchDutch West IndianEastern EuropeanEcuadorianEgyptianEnglishEstonianEthiopianEuropeanFijianFilipinoFinnishFrenchFrench American IndianFrench CanadianGermanGerman RussianGhanaianGreekGuamanian/ChamorroGuatemalanGuyaneseHaitianHmongHonduranHopiHoumaHungarianIcelanderIndian (Asian)IndonesianInupiatIranianIrishIroquoisIsraeliItalianJamaicanJapaneseJordanianKenyanKiowaKoreanLaotianLatvianLebaneseLiberianLithuanianLumbeeLuxembourgerMacedonianMalaysianMalteseMarshalleseMenomineeMexicanMexican American IndianMongolianMoroccanNative HawaiianNavajoNepaleseNew ZealanderNicaraguanNigerianNorthern EuropeanNorwegianOkinawanOsageOttawaPaiutePakistaniPalestinianPanamanianParaguayanPennsylvania GermanPeruvianPimaPolishPortuguesePotawatomiPuebloPuerto RicanPuget Sound SalishRomanianRussianSalvadoranSamoanScandinavianScotch-IrishScottishSeminoleSenegaleseSerbianShoshoneSierra LeoneanSiouxSlavicSlovakSloveneSomaliSouth AfricanSouth AmericanSouth American IndianSoviet UnionSpaniardSpanishSpanish AmericanSpanish American IndianSri LankanSubsaharan AfricanSudaneseSwedishSwissSyrianTaiwaneseThaiTlingit-HaidaTohono O'OdhamTonganTrinidadian and TobagonianTsimshianTurkishU.S. Virgin IslanderUgandanUkrainianUruguayanUteVenezuelanVietnameseWelshWest IndianYakamaYaquiYugoslavianYumanYup'ikZimbabwean
Immigration
NonimmigrantsImmigrantsAfghanistanAfricaAlbaniaArgentinaArmeniaAsiaAustraliaAustriaBahamasBangladeshBarbadosBelarusBelgiumBelizeBoliviaBosnia and HerzegovinaBrazilBulgariaBurma/MyanmarCabo VerdeCambodiaCameroonCanadaCaribbeanCentral AmericaChileChinaColombiaCongoCosta RicaCroatiaCubaCzechoslovakiaDenmarkDominicaDominican RepublicEastern AfricaEastern AsiaEastern EuropeEcuadorEgyptEl SalvadorEnglandEritreaEthiopiaEuropeFijiFranceGermanyGhanaGreeceGrenadaGuatemalaGuyanaHaitiHondurasHong KongHungaryIndiaIndonesiaIranIraqIrelandIsraelItalyJamaicaJapanJordanKazakhstanKenyaKoreaKuwaitLaosLatin AmericaLatviaLebanonLiberiaLithuaniaMalaysiaMexicoMicronesiaMiddle AfricaMoldovaMoroccoNepalNetherlandsNicaraguaNigeriaNorth AmericaNorth MacedoniaNorthern AfricaNorthern EuropeNorwayOceaniaPakistanPanamaPeruPhilippinesPolandPortugalRomaniaRussiaSaudi ArabiaScotlandSenegalSerbiaSierra LeoneSingaporeSomaliaSouth AfricaSouth AmericaSouth Central AsiaSouth Eastern AsiaSouthern EuropeSpainSri LankaSt. Vincent and the GrenadinesSudanSwedenSwitzerlandSyriaTaiwanThailandTrinidad and TobagoTurkeyUgandaUkraineUruguayUzbekistanVenezuelaVietnamWest IndiesWestern AfricaWestern AsiaWestern EuropeYemenZaireZimbabweAzores
Iraqi
Race
Ancestry
AfghanAfricanAlaska NativeAlaskan AthabascanAlbanianAleutAlsatianAmericanApacheArabArapahoArgentineanArmenianAssyrian/Chaldean/SyriacAustralianAustrianBahamianBangladeshiBarbadianBasqueBelgianBelizeanBermudanBhutaneseBlackfeetBolivianBrazilianBritishBritish West IndianBulgarianBurmeseCajunCambodianCanadianCape VerdeanCarpatho RusynCelticCentral AmericanCentral American IndianCherokeeCheyenneChickasawChileanChineseChippewaChoctawColombianColvilleComancheCosta RicanCreeCreekCroatianCrowCubanCypriotCzechCzechoslovakianDanishDelawareDominicanDutchDutch West IndianEastern EuropeanEcuadorianEgyptianEnglishEstonianEthiopianEuropeanFijianFilipinoFinnishFrenchFrench American IndianFrench CanadianGermanGerman RussianGhanaianGreekGuamanian/ChamorroGuatemalanGuyaneseHaitianHmongHonduranHopiHoumaHungarianIcelanderIndian (Asian)IndonesianInupiatIranianIraqiIrishIroquoisIsraeliItalianJamaicanJapaneseJordanianKenyanKiowaKoreanLaotianLatvianLebaneseLiberianLithuanianLumbeeLuxembourgerMacedonianMalaysianMalteseMarshalleseMenomineeMexicanMexican American IndianMongolianMoroccanNative HawaiianNavajoNepaleseNew ZealanderNicaraguanNigerianNorthern EuropeanNorwegianOkinawanOsageOttawaPaiutePakistaniPalestinianPanamanianParaguayanPennsylvania GermanPeruvianPimaPolishPortuguesePotawatomiPuebloPuerto RicanPuget Sound SalishRomanianRussianSalvadoranSamoanScandinavianScotch-IrishScottishSeminoleSenegaleseSerbianShoshoneSierra LeoneanSiouxSlavicSlovakSloveneSomaliSouth AfricanSouth AmericanSouth American IndianSoviet UnionSpaniardSpanishSpanish AmericanSpanish American IndianSri LankanSubsaharan AfricanSudaneseSwedishSwissSyrianTaiwaneseThaiTlingit-HaidaTohono O'OdhamTonganTrinidadian and TobagonianTsimshianTurkishU.S. Virgin IslanderUgandanUkrainianUruguayanUteVenezuelanVietnameseWelshWest IndianYakamaYaquiYugoslavianYumanYup'ikZimbabwean
Immigration
NonimmigrantsImmigrantsAfghanistanAfricaAlbaniaArgentinaArmeniaAsiaAustraliaAustriaBahamasBangladeshBarbadosBelarusBelgiumBelizeBoliviaBosnia and HerzegovinaBrazilBulgariaBurma/MyanmarCabo VerdeCambodiaCameroonCanadaCaribbeanCentral AmericaChileChinaColombiaCongoCosta RicaCroatiaCubaCzechoslovakiaDenmarkDominicaDominican RepublicEastern AfricaEastern AsiaEastern EuropeEcuadorEgyptEl SalvadorEnglandEritreaEthiopiaEuropeFijiFranceGermanyGhanaGreeceGrenadaGuatemalaGuyanaHaitiHong KongHungaryIndiaIndonesiaIranIraqIrelandIsraelItalyJamaicaJapanJordanKazakhstanKenyaKoreaKuwaitLaosLatin AmericaLatviaLebanonLiberiaLithuaniaMalaysiaMexicoMicronesiaMiddle AfricaMoldovaMoroccoNepalNetherlandsNicaraguaNigeriaNorth AmericaNorth MacedoniaNorthern AfricaNorthern EuropeNorwayOceaniaPakistanPanamaPeruPhilippinesPolandPortugalRomaniaRussiaSaudi ArabiaScotlandSenegalSerbiaSierra LeoneSingaporeSomaliaSouth AfricaSouth AmericaSouth Central AsiaSouth Eastern AsiaSouthern EuropeSpainSri LankaSt. Vincent and the GrenadinesSudanSwedenSwitzerlandSyriaTaiwanThailandTrinidad and TobagoTurkeyUgandaUkraineUruguayUzbekistanVenezuelaVietnamWest IndiesWestern AfricaWestern AsiaWestern EuropeYemenZaireZimbabweAzores
In Labor Force | Age 20-64
Income
Poverty
Unemployment
Labor Participation
Family Structure
Vehicle Availability
Education Level
Disability

In Labor Force | Age 20-64 Comparison

Immigrants from Honduras

Iraqis

Tragic
Poor
78.7%
IN LABOR FORCE | AGE 20-64
0.6/ 100
METRIC RATING
252nd/ 347
METRIC RANK
79.3%
IN LABOR FORCE | AGE 20-64
17.7/ 100
METRIC RATING
203rd/ 347
METRIC RANK

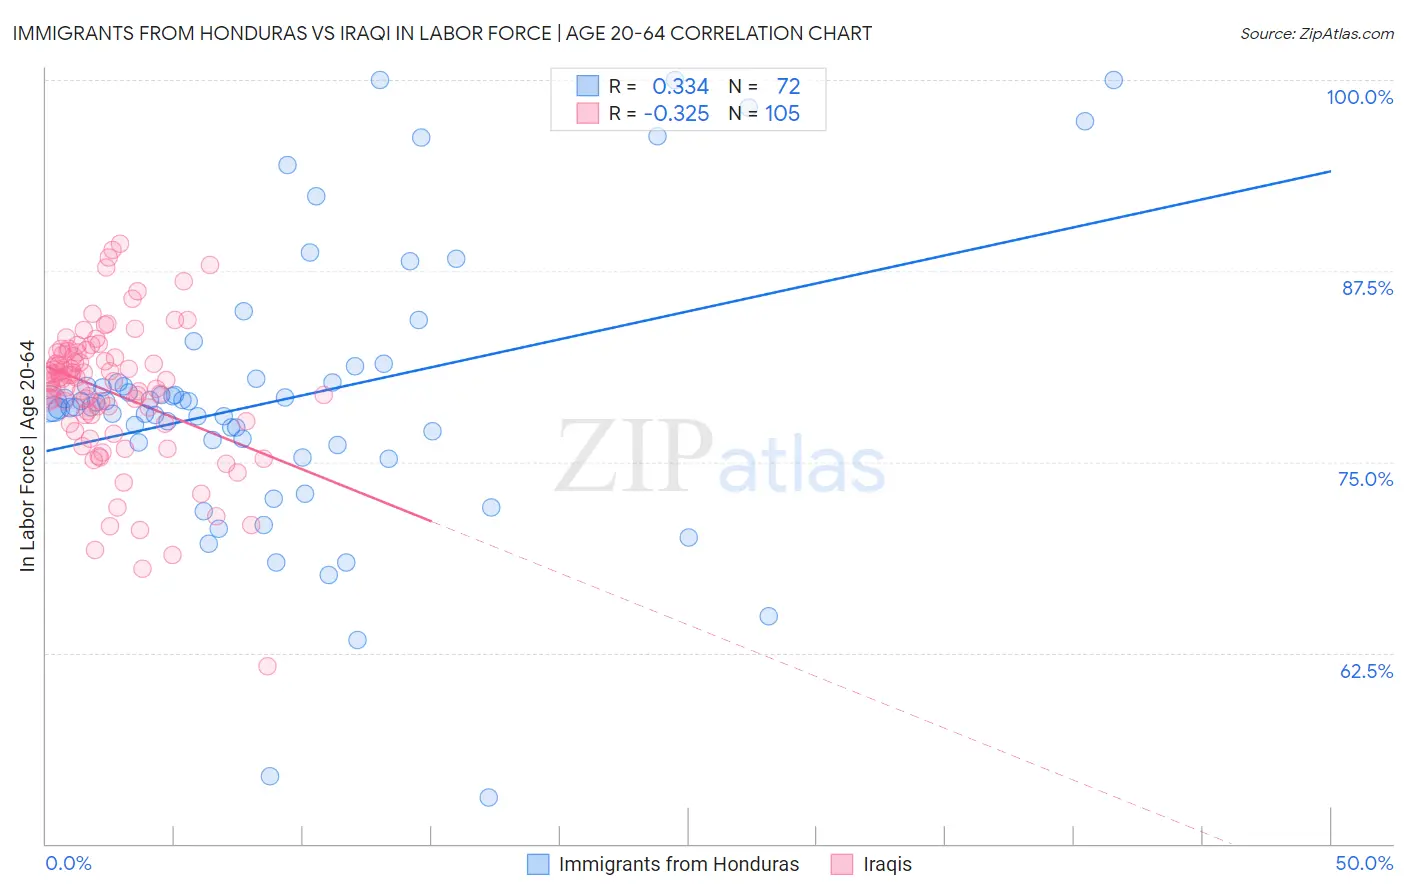
Immigrants from Honduras vs Iraqi In Labor Force | Age 20-64 Correlation Chart

The statistical analysis conducted on geographies consisting of 322,602,752 people shows a mild positive correlation between the proportion of Immigrants from Honduras and labor force participation rate among population between the ages 20 and 64 in the United States with a correlation coefficient (R) of 0.334 and weighted average of 78.7%. Similarly, the statistical analysis conducted on geographies consisting of 170,648,723 people shows a mild negative correlation between the proportion of Iraqis and labor force participation rate among population between the ages 20 and 64 in the United States with a correlation coefficient (R) of -0.325 and weighted average of 79.3%, a difference of 0.73%.
Immigrants from Honduras vs Iraqi In Labor Force | Age 20-64

In Labor Force | Age 20-64 Correlation Summary

MeasurementImmigrants from HondurasIraqi
Minimum53.0%61.6%
Maximum100.0%89.3%
Range47.0%27.7%
Mean79.2%79.6%
Median78.7%80.3%
Interquartile 25% (IQ1)76.2%77.6%
Interquartile 75% (IQ3)80.3%82.1%
Interquartile Range (IQR)4.1%4.5%
Standard Deviation (Sample)9.2%4.6%
Standard Deviation (Population)9.2%4.6%

Similar Demographics by In Labor Force | Age 20-64

Demographics Similar to Immigrants from Honduras by In Labor Force | Age 20-64

In terms of in labor force | age 20-64, the demographic groups most similar to Immigrants from Honduras are Basque (78.7%, a difference of 0.010%), Immigrants from Lebanon (78.7%, a difference of 0.010%), Hawaiian (78.7%, a difference of 0.030%), Celtic (78.7%, a difference of 0.040%), and Barbadian (78.8%, a difference of 0.050%).
DemographicsRating | RankIn Labor Force | Age 20-64
Scottish
1.3
/100
|
#245
Tragic
78.9%
Immigrants | Trinidad and Tobago
1.1
/100
|
#246
Tragic
78.8%
Immigrants | Germany
1.0
/100
|
#247
Tragic
78.8%
Immigrants | Caribbean
1.0
/100
|
#248
Tragic
78.8%
English
0.9
/100
|
#249
Tragic
78.8%
Hondurans
0.8
/100
|
#250
Tragic
78.8%
Barbadians
0.7
/100
|
#251
Tragic
78.8%
Immigrants | Honduras
0.6
/100
|
#252
Tragic
78.7%
Basques
0.5
/100
|
#253
Tragic
78.7%
Immigrants | Lebanon
0.5
/100
|
#254
Tragic
78.7%
Hawaiians
0.5
/100
|
#255
Tragic
78.7%
Celtics
0.5
/100
|
#256
Tragic
78.7%
Guatemalans
0.4
/100
|
#257
Tragic
78.7%
Immigrants | Guatemala
0.4
/100
|
#258
Tragic
78.7%
Tsimshian
0.4
/100
|
#259
Tragic
78.7%

Demographics Similar to Iraqis by In Labor Force | Age 20-64

In terms of in labor force | age 20-64, the demographic groups most similar to Iraqis are Immigrants from Cambodia (79.3%, a difference of 0.0%), Immigrants from Congo (79.3%, a difference of 0.0%), Nicaraguan (79.3%, a difference of 0.010%), Immigrants from Ecuador (79.3%, a difference of 0.010%), and Immigrants from Oceania (79.3%, a difference of 0.020%).
DemographicsRating | RankIn Labor Force | Age 20-64
Ecuadorians
23.1
/100
|
#196
Fair
79.4%
Immigrants | Senegal
22.5
/100
|
#197
Fair
79.4%
Immigrants | Laos
21.5
/100
|
#198
Fair
79.4%
Dutch
20.2
/100
|
#199
Fair
79.3%
Immigrants | Oceania
19.1
/100
|
#200
Poor
79.3%
Immigrants | Nicaragua
19.0
/100
|
#201
Poor
79.3%
Nicaraguans
18.3
/100
|
#202
Poor
79.3%
Iraqis
17.7
/100
|
#203
Poor
79.3%
Immigrants | Cambodia
17.6
/100
|
#204
Poor
79.3%
Immigrants | Congo
17.5
/100
|
#205
Poor
79.3%
Immigrants | Ecuador
16.9
/100
|
#206
Poor
79.3%
Sub-Saharan Africans
16.5
/100
|
#207
Poor
79.3%
British
16.5
/100
|
#208
Poor
79.3%
Bangladeshis
16.4
/100
|
#209
Poor
79.3%
Haitians
16.1
/100
|
#210
Poor
79.3%