Immigrants from Haiti vs Immigrants from Bahamas In Labor Force | Age 25-29
COMPARE
Immigrants from Haiti
Immigrants from Bahamas
In Labor Force | Age 25-29
In Labor Force | Age 25-29 Comparison
Immigrants from Haiti
Immigrants from Bahamas
83.7%
IN LABOR FORCE | AGE 25-29
0.2/ 100
METRIC RATING
256th/ 347
METRIC RANK
83.6%
IN LABOR FORCE | AGE 25-29
0.1/ 100
METRIC RATING
260th/ 347
METRIC RANK
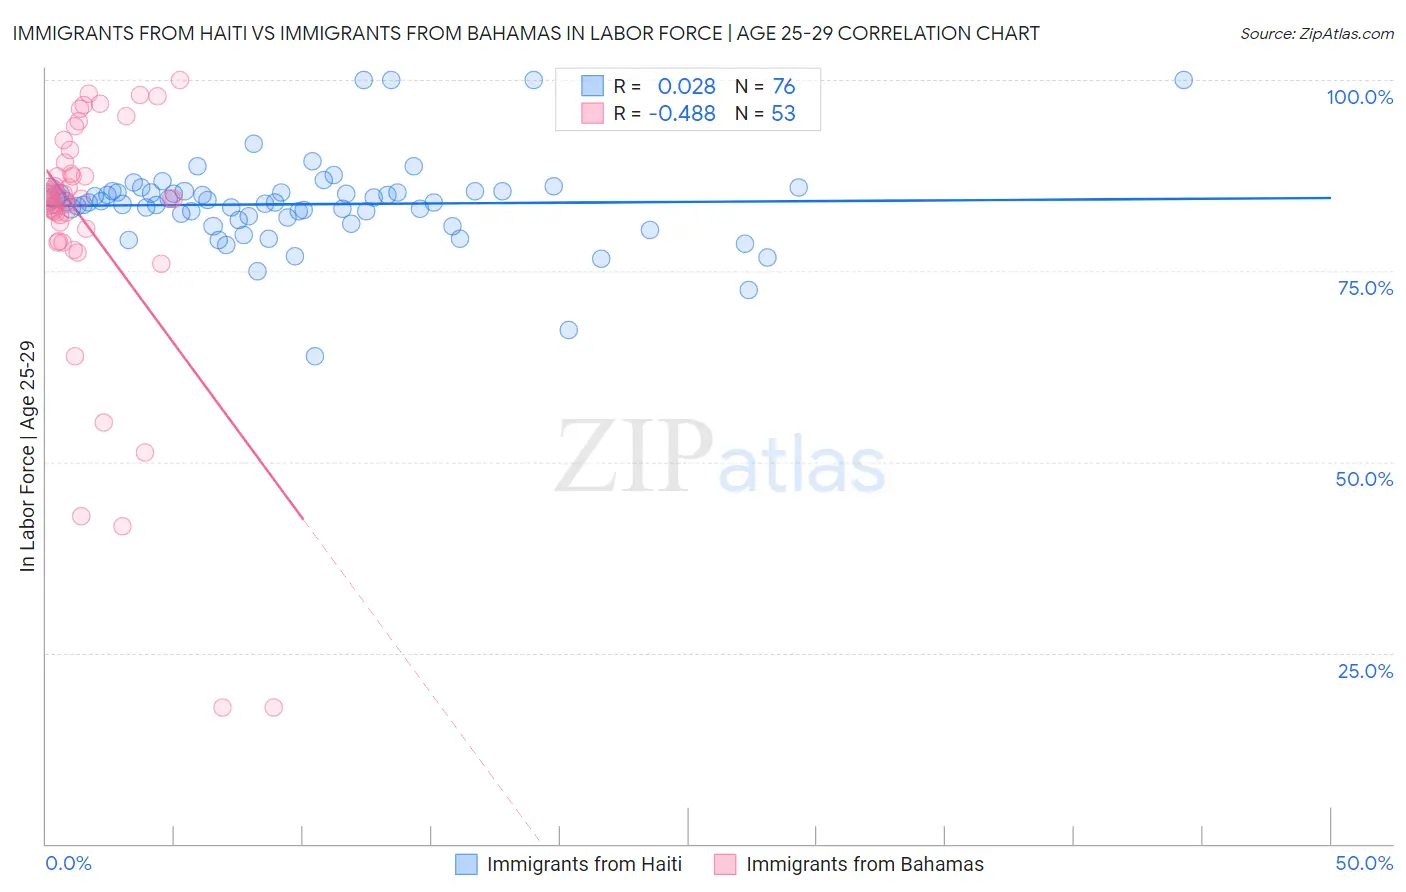
Immigrants from Haiti vs Immigrants from Bahamas In Labor Force | Age 25-29 Correlation Chart
The statistical analysis conducted on geographies consisting of 225,226,191 people shows no correlation between the proportion of Immigrants from Haiti and labor force participation rate among population between the ages 25 and 29 in the United States with a correlation coefficient (R) of 0.028 and weighted average of 83.7%. Similarly, the statistical analysis conducted on geographies consisting of 104,655,808 people shows a moderate negative correlation between the proportion of Immigrants from Bahamas and labor force participation rate among population between the ages 25 and 29 in the United States with a correlation coefficient (R) of -0.488 and weighted average of 83.6%, a difference of 0.060%.
In Labor Force | Age 25-29 Correlation Summary
| Measurement | Immigrants from Haiti | Immigrants from Bahamas |
| Minimum | 63.8% | 17.9% |
| Maximum | 100.0% | 100.0% |
| Range | 36.2% | 82.1% |
| Mean | 83.7% | 80.7% |
| Median | 84.0% | 84.4% |
| Interquartile 25% (IQ1) | 81.8% | 79.7% |
| Interquartile 75% (IQ3) | 85.3% | 88.5% |
| Interquartile Range (IQR) | 3.5% | 8.8% |
| Standard Deviation (Sample) | 5.8% | 17.6% |
| Standard Deviation (Population) | 5.8% | 17.4% |
Demographics Similar to Immigrants from Haiti and Immigrants from Bahamas by In Labor Force | Age 25-29
In terms of in labor force | age 25-29, the demographic groups most similar to Immigrants from Haiti are Haitian (83.7%, a difference of 0.010%), Delaware (83.7%, a difference of 0.010%), Guatemalan (83.7%, a difference of 0.020%), Immigrants from Trinidad and Tobago (83.7%, a difference of 0.020%), and Spaniard (83.7%, a difference of 0.020%). Similarly, the demographic groups most similar to Immigrants from Bahamas are Pennsylvania German (83.6%, a difference of 0.0%), Spanish (83.6%, a difference of 0.010%), Immigrants from Guatemala (83.6%, a difference of 0.020%), Delaware (83.7%, a difference of 0.060%), and Haitian (83.7%, a difference of 0.070%).
| Demographics | Rating | Rank | In Labor Force | Age 25-29 |
| Immigrants | Nonimmigrants | 0.3 /100 | #248 | Tragic 83.7% |
| Hmong | 0.3 /100 | #249 | Tragic 83.7% |
| Central Americans | 0.2 /100 | #250 | Tragic 83.7% |
| Bahamians | 0.2 /100 | #251 | Tragic 83.7% |
| Guatemalans | 0.2 /100 | #252 | Tragic 83.7% |
| Immigrants | Trinidad and Tobago | 0.2 /100 | #253 | Tragic 83.7% |
| Spaniards | 0.2 /100 | #254 | Tragic 83.7% |
| Haitians | 0.2 /100 | #255 | Tragic 83.7% |
| Immigrants | Haiti | 0.2 /100 | #256 | Tragic 83.7% |
| Delaware | 0.2 /100 | #257 | Tragic 83.7% |
| Immigrants | Guatemala | 0.1 /100 | #258 | Tragic 83.6% |
| Spanish | 0.1 /100 | #259 | Tragic 83.6% |
| Immigrants | Bahamas | 0.1 /100 | #260 | Tragic 83.6% |
| Pennsylvania Germans | 0.1 /100 | #261 | Tragic 83.6% |
| Immigrants | Fiji | 0.1 /100 | #262 | Tragic 83.6% |
| West Indians | 0.1 /100 | #263 | Tragic 83.5% |
| Puget Sound Salish | 0.1 /100 | #264 | Tragic 83.5% |
| Cubans | 0.1 /100 | #265 | Tragic 83.5% |
| Aleuts | 0.0 /100 | #266 | Tragic 83.4% |
| Spanish Americans | 0.0 /100 | #267 | Tragic 83.4% |
| Immigrants | Lebanon | 0.0 /100 | #268 | Tragic 83.4% |