Immigrants from Guyana vs Immigrants from Belgium In Labor Force | Age 30-34

COMPARE

Immigrants from Guyana
Race
Ancestry
AfghanAfricanAlaska NativeAlaskan AthabascanAlbanianAleutAlsatianAmericanApacheArabArapahoArgentineanArmenianAssyrian/Chaldean/SyriacAustralianAustrianBahamianBangladeshiBarbadianBasqueBelgianBelizeanBermudanBhutaneseBlackfeetBolivianBrazilianBritishBritish West IndianBulgarianBurmeseCajunCambodianCanadianCape VerdeanCarpatho RusynCelticCentral AmericanCentral American IndianCherokeeCheyenneChickasawChileanChineseChippewaChoctawColombianColvilleComancheCosta RicanCreeCreekCroatianCrowCubanCypriotCzechCzechoslovakianDanishDelawareDominicanDutchDutch West IndianEastern EuropeanEcuadorianEgyptianEnglishEstonianEthiopianEuropeanFijianFilipinoFinnishFrenchFrench American IndianFrench CanadianGermanGerman RussianGhanaianGreekGuamanian/ChamorroGuatemalanGuyaneseHaitianHmongHonduranHopiHoumaHungarianIcelanderIndian (Asian)IndonesianInupiatIranianIraqiIrishIroquoisIsraeliItalianJamaicanJapaneseJordanianKenyanKiowaKoreanLaotianLatvianLebaneseLiberianLithuanianLumbeeLuxembourgerMacedonianMalaysianMalteseMarshalleseMenomineeMexicanMexican American IndianMongolianMoroccanNative HawaiianNavajoNepaleseNew ZealanderNicaraguanNigerianNorthern EuropeanNorwegianOkinawanOsageOttawaPaiutePakistaniPalestinianPanamanianParaguayanPennsylvania GermanPeruvianPimaPolishPortuguesePotawatomiPuebloPuerto RicanPuget Sound SalishRomanianRussianSalvadoranSamoanScandinavianScotch-IrishScottishSeminoleSenegaleseSerbianShoshoneSierra LeoneanSiouxSlavicSlovakSloveneSomaliSouth AfricanSouth AmericanSouth American IndianSoviet UnionSpaniardSpanishSpanish AmericanSpanish American IndianSri LankanSubsaharan AfricanSudaneseSwedishSwissSyrianTaiwaneseThaiTlingit-HaidaTohono O'OdhamTonganTrinidadian and TobagonianTsimshianTurkishU.S. Virgin IslanderUgandanUkrainianUruguayanUteVenezuelanVietnameseWelshWest IndianYakamaYaquiYugoslavianYumanYup'ikZimbabwean
Immigration
NonimmigrantsImmigrantsAfghanistanAfricaAlbaniaArgentinaArmeniaAsiaAustraliaAustriaBahamasBangladeshBarbadosBelarusBelizeBoliviaBosnia and HerzegovinaBrazilBulgariaBurma/MyanmarCabo VerdeCambodiaCameroonCanadaCaribbeanCentral AmericaChileChinaColombiaCongoCosta RicaCroatiaCubaCzechoslovakiaDenmarkDominicaDominican RepublicEastern AfricaEastern AsiaEastern EuropeEcuadorEgyptEl SalvadorEnglandEritreaEthiopiaEuropeFijiFranceGermanyGhanaGreeceGrenadaGuatemalaGuyanaHaitiHondurasHong KongHungaryIndiaIndonesiaIranIraqIrelandIsraelItalyJamaicaJapanJordanKazakhstanKenyaKoreaKuwaitLaosLatin AmericaLatviaLebanonLiberiaLithuaniaMalaysiaMexicoMicronesiaMiddle AfricaMoldovaMoroccoNepalNetherlandsNicaraguaNigeriaNorth AmericaNorth MacedoniaNorthern AfricaNorthern EuropeNorwayOceaniaPakistanPanamaPeruPhilippinesPolandPortugalRomaniaRussiaSaudi ArabiaScotlandSenegalSerbiaSierra LeoneSingaporeSomaliaSouth AfricaSouth AmericaSouth Central AsiaSouth Eastern AsiaSouthern EuropeSpainSri LankaSt. Vincent and the GrenadinesSudanSwedenSwitzerlandSyriaTaiwanThailandTrinidad and TobagoTurkeyUgandaUkraineUruguayUzbekistanVenezuelaVietnamWest IndiesWestern AfricaWestern AsiaWestern EuropeYemenZaireZimbabweAzores
Immigrants from Belgium
Race
Ancestry
AfghanAfricanAlaska NativeAlaskan AthabascanAlbanianAleutAlsatianAmericanApacheArabArapahoArgentineanArmenianAssyrian/Chaldean/SyriacAustralianAustrianBahamianBangladeshiBarbadianBasqueBelgianBelizeanBermudanBhutaneseBlackfeetBolivianBrazilianBritishBritish West IndianBulgarianBurmeseCajunCambodianCanadianCape VerdeanCarpatho RusynCelticCentral AmericanCentral American IndianCherokeeCheyenneChickasawChileanChineseChippewaChoctawColombianColvilleComancheCosta RicanCreeCreekCroatianCrowCubanCypriotCzechCzechoslovakianDanishDelawareDominicanDutchDutch West IndianEastern EuropeanEcuadorianEgyptianEnglishEstonianEthiopianEuropeanFijianFilipinoFinnishFrenchFrench American IndianFrench CanadianGermanGerman RussianGhanaianGreekGuamanian/ChamorroGuatemalanGuyaneseHaitianHmongHonduranHopiHoumaHungarianIcelanderIndian (Asian)IndonesianInupiatIranianIraqiIrishIroquoisIsraeliItalianJamaicanJapaneseJordanianKenyanKiowaKoreanLaotianLatvianLebaneseLiberianLithuanianLumbeeLuxembourgerMacedonianMalaysianMalteseMarshalleseMenomineeMexicanMexican American IndianMongolianMoroccanNative HawaiianNavajoNepaleseNew ZealanderNicaraguanNigerianNorthern EuropeanNorwegianOkinawanOsageOttawaPaiutePakistaniPalestinianPanamanianParaguayanPennsylvania GermanPeruvianPimaPolishPortuguesePotawatomiPuebloPuerto RicanPuget Sound SalishRomanianRussianSalvadoranSamoanScandinavianScotch-IrishScottishSeminoleSenegaleseSerbianShoshoneSierra LeoneanSiouxSlavicSlovakSloveneSomaliSouth AfricanSouth AmericanSouth American IndianSoviet UnionSpaniardSpanishSpanish AmericanSpanish American IndianSri LankanSubsaharan AfricanSudaneseSwedishSwissSyrianTaiwaneseThaiTlingit-HaidaTohono O'OdhamTonganTrinidadian and TobagonianTsimshianTurkishU.S. Virgin IslanderUgandanUkrainianUruguayanUteVenezuelanVietnameseWelshWest IndianYakamaYaquiYugoslavianYumanYup'ikZimbabwean
Immigration
NonimmigrantsImmigrantsAfghanistanAfricaAlbaniaArgentinaArmeniaAsiaAustraliaAustriaBahamasBangladeshBarbadosBelarusBelgiumBelizeBoliviaBosnia and HerzegovinaBrazilBulgariaBurma/MyanmarCabo VerdeCambodiaCameroonCanadaCaribbeanCentral AmericaChileChinaColombiaCongoCosta RicaCroatiaCubaCzechoslovakiaDenmarkDominicaDominican RepublicEastern AfricaEastern AsiaEastern EuropeEcuadorEgyptEl SalvadorEnglandEritreaEthiopiaEuropeFijiFranceGermanyGhanaGreeceGrenadaGuatemalaHaitiHondurasHong KongHungaryIndiaIndonesiaIranIraqIrelandIsraelItalyJamaicaJapanJordanKazakhstanKenyaKoreaKuwaitLaosLatin AmericaLatviaLebanonLiberiaLithuaniaMalaysiaMexicoMicronesiaMiddle AfricaMoldovaMoroccoNepalNetherlandsNicaraguaNigeriaNorth AmericaNorth MacedoniaNorthern AfricaNorthern EuropeNorwayOceaniaPakistanPanamaPeruPhilippinesPolandPortugalRomaniaRussiaSaudi ArabiaScotlandSenegalSerbiaSierra LeoneSingaporeSomaliaSouth AfricaSouth AmericaSouth Central AsiaSouth Eastern AsiaSouthern EuropeSpainSri LankaSt. Vincent and the GrenadinesSudanSwedenSwitzerlandSyriaTaiwanThailandTrinidad and TobagoTurkeyUgandaUkraineUruguayUzbekistanVenezuelaVietnamWest IndiesWestern AfricaWestern AsiaWestern EuropeYemenZaireZimbabweAzores
In Labor Force | Age 30-34
Income
Poverty
Unemployment
Labor Participation
Family Structure
Vehicle Availability
Education Level
Disability

In Labor Force | Age 30-34 Comparison

Immigrants from Guyana

Immigrants from Belgium

Tragic
Exceptional
83.8%
IN LABOR FORCE | AGE 30-34
0.2/ 100
METRIC RATING
263rd/ 347
METRIC RANK
85.3%
IN LABOR FORCE | AGE 30-34
98.2/ 100
METRIC RATING
88th/ 347
METRIC RANK

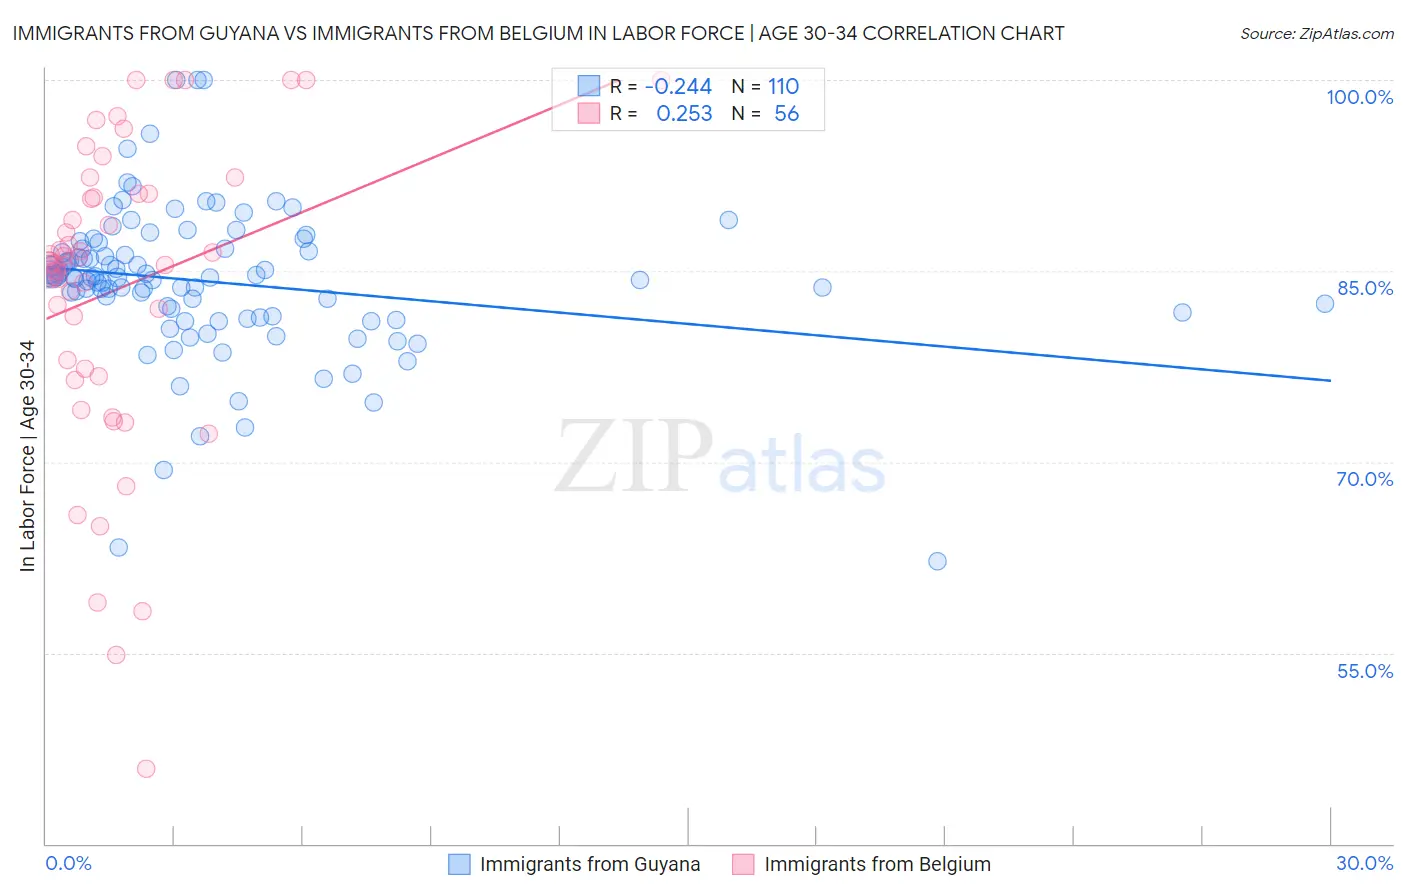
Immigrants from Guyana vs Immigrants from Belgium In Labor Force | Age 30-34 Correlation Chart

The statistical analysis conducted on geographies consisting of 183,640,015 people shows a weak negative correlation between the proportion of Immigrants from Guyana and labor force participation rate among population between the ages 30 and 34 in the United States with a correlation coefficient (R) of -0.244 and weighted average of 83.8%. Similarly, the statistical analysis conducted on geographies consisting of 146,692,103 people shows a weak positive correlation between the proportion of Immigrants from Belgium and labor force participation rate among population between the ages 30 and 34 in the United States with a correlation coefficient (R) of 0.253 and weighted average of 85.3%, a difference of 1.8%.
Immigrants from Guyana vs Immigrants from Belgium In Labor Force | Age 30-34

In Labor Force | Age 30-34 Correlation Summary

MeasurementImmigrants from GuyanaImmigrants from Belgium
Minimum62.2%45.9%
Maximum100.0%100.0%
Range37.8%54.1%
Mean84.1%83.6%
Median84.5%85.6%
Interquartile 25% (IQ1)81.4%77.0%
Interquartile 75% (IQ3)86.8%91.1%
Interquartile Range (IQR)5.4%14.1%
Standard Deviation (Sample)5.9%12.1%
Standard Deviation (Population)5.8%12.0%

Similar Demographics by In Labor Force | Age 30-34

Demographics Similar to Immigrants from Guyana by In Labor Force | Age 30-34

In terms of in labor force | age 30-34, the demographic groups most similar to Immigrants from Guyana are Dominican (83.8%, a difference of 0.0%), Guyanese (83.8%, a difference of 0.020%), Immigrants from Dominican Republic (83.8%, a difference of 0.030%), Honduran (83.8%, a difference of 0.050%), and Scotch-Irish (83.8%, a difference of 0.050%).
DemographicsRating | RankIn Labor Force | Age 30-34
Immigrants | Lebanon
0.4
/100
|
#256
Tragic
83.9%
Iraqis
0.3
/100
|
#257
Tragic
83.8%
Hondurans
0.3
/100
|
#258
Tragic
83.8%
Scotch-Irish
0.3
/100
|
#259
Tragic
83.8%
Immigrants | Dominican Republic
0.3
/100
|
#260
Tragic
83.8%
Guyanese
0.3
/100
|
#261
Tragic
83.8%
Dominicans
0.2
/100
|
#262
Tragic
83.8%
Immigrants | Guyana
0.2
/100
|
#263
Tragic
83.8%
Guatemalans
0.2
/100
|
#264
Tragic
83.7%
Immigrants | Honduras
0.1
/100
|
#265
Tragic
83.7%
Immigrants | Guatemala
0.1
/100
|
#266
Tragic
83.7%
Spaniards
0.1
/100
|
#267
Tragic
83.6%
Immigrants | Bangladesh
0.1
/100
|
#268
Tragic
83.6%
Vietnamese
0.1
/100
|
#269
Tragic
83.6%
Spanish Americans
0.0
/100
|
#270
Tragic
83.5%

Demographics Similar to Immigrants from Belgium by In Labor Force | Age 30-34

In terms of in labor force | age 30-34, the demographic groups most similar to Immigrants from Belgium are Immigrants from Taiwan (85.3%, a difference of 0.010%), Immigrants from Northern Europe (85.3%, a difference of 0.010%), Immigrants from Kazakhstan (85.3%, a difference of 0.010%), Burmese (85.3%, a difference of 0.020%), and Mongolian (85.3%, a difference of 0.030%).
DemographicsRating | RankIn Labor Force | Age 30-34
Slovaks
98.7
/100
|
#81
Exceptional
85.3%
Immigrants | Africa
98.6
/100
|
#82
Exceptional
85.3%
Immigrants | Europe
98.6
/100
|
#83
Exceptional
85.3%
Greeks
98.6
/100
|
#84
Exceptional
85.3%
Mongolians
98.5
/100
|
#85
Exceptional
85.3%
Immigrants | Taiwan
98.3
/100
|
#86
Exceptional
85.3%
Immigrants | Northern Europe
98.2
/100
|
#87
Exceptional
85.3%
Immigrants | Belgium
98.2
/100
|
#88
Exceptional
85.3%
Immigrants | Kazakhstan
98.1
/100
|
#89
Exceptional
85.3%
Burmese
97.9
/100
|
#90
Exceptional
85.3%
Immigrants | Moldova
97.9
/100
|
#91
Exceptional
85.3%
German Russians
97.7
/100
|
#92
Exceptional
85.2%
Immigrants | Norway
97.6
/100
|
#93
Exceptional
85.2%
Swedes
97.5
/100
|
#94
Exceptional
85.2%
Immigrants | India
97.4
/100
|
#95
Exceptional
85.2%