Immigrants from Guatemala vs Immigrants from Bosnia and Herzegovina In Labor Force | Age 20-64
COMPARE
Immigrants from Guatemala
Immigrants from Bosnia and Herzegovina
In Labor Force | Age 20-64
In Labor Force | Age 20-64 Comparison
Immigrants from Guatemala
Immigrants from Bosnia and Herzegovina
78.7%
IN LABOR FORCE | AGE 20-64
0.4/ 100
METRIC RATING
258th/ 347
METRIC RANK
80.8%
IN LABOR FORCE | AGE 20-64
100.0/ 100
METRIC RATING
23rd/ 347
METRIC RANK
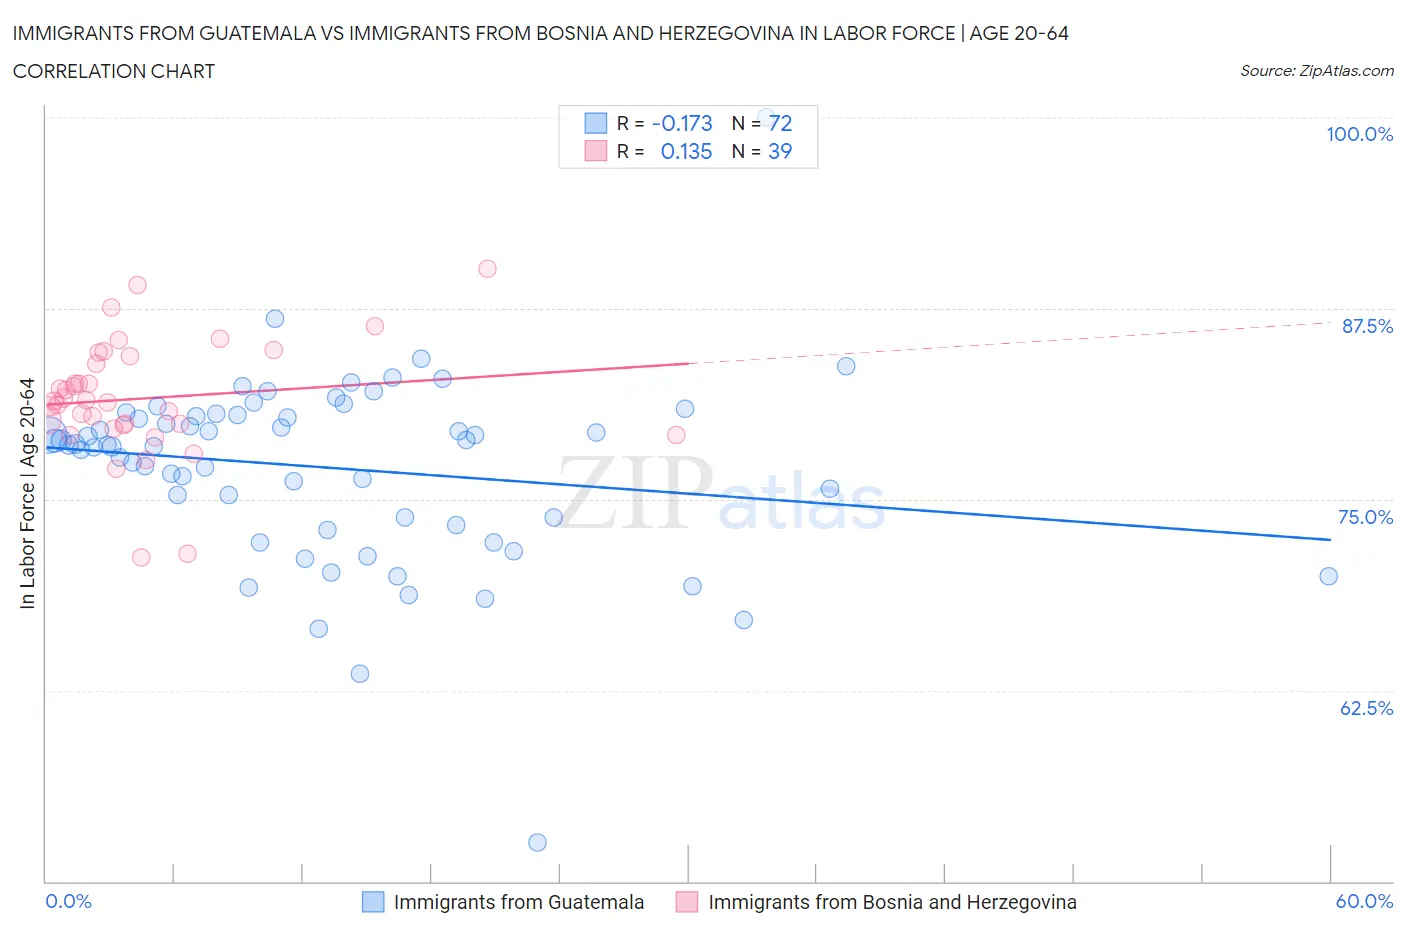
Immigrants from Guatemala vs Immigrants from Bosnia and Herzegovina In Labor Force | Age 20-64 Correlation Chart
The statistical analysis conducted on geographies consisting of 377,275,045 people shows a poor negative correlation between the proportion of Immigrants from Guatemala and labor force participation rate among population between the ages 20 and 64 in the United States with a correlation coefficient (R) of -0.173 and weighted average of 78.7%. Similarly, the statistical analysis conducted on geographies consisting of 156,819,568 people shows a poor positive correlation between the proportion of Immigrants from Bosnia and Herzegovina and labor force participation rate among population between the ages 20 and 64 in the United States with a correlation coefficient (R) of 0.135 and weighted average of 80.8%, a difference of 2.7%.
In Labor Force | Age 20-64 Correlation Summary
| Measurement | Immigrants from Guatemala | Immigrants from Bosnia and Herzegovina |
| Minimum | 52.5% | 71.2% |
| Maximum | 100.0% | 90.1% |
| Range | 47.5% | 18.9% |
| Mean | 77.1% | 81.6% |
| Median | 78.6% | 81.4% |
| Interquartile 25% (IQ1) | 73.6% | 79.8% |
| Interquartile 75% (IQ3) | 80.5% | 84.4% |
| Interquartile Range (IQR) | 6.9% | 4.5% |
| Standard Deviation (Sample) | 6.2% | 3.8% |
| Standard Deviation (Population) | 6.2% | 3.8% |
Similar Demographics by In Labor Force | Age 20-64
Demographics Similar to Immigrants from Guatemala by In Labor Force | Age 20-64
In terms of in labor force | age 20-64, the demographic groups most similar to Immigrants from Guatemala are Guatemalan (78.7%, a difference of 0.0%), Hawaiian (78.7%, a difference of 0.020%), Celtic (78.7%, a difference of 0.020%), Tsimshian (78.7%, a difference of 0.030%), and Basque (78.7%, a difference of 0.040%).
| Demographics | Rating | Rank | In Labor Force | Age 20-64 |
| Barbadians | 0.7 /100 | #251 | Tragic 78.8% |
| Immigrants | Honduras | 0.6 /100 | #252 | Tragic 78.7% |
| Basques | 0.5 /100 | #253 | Tragic 78.7% |
| Immigrants | Lebanon | 0.5 /100 | #254 | Tragic 78.7% |
| Hawaiians | 0.5 /100 | #255 | Tragic 78.7% |
| Celtics | 0.5 /100 | #256 | Tragic 78.7% |
| Guatemalans | 0.4 /100 | #257 | Tragic 78.7% |
| Immigrants | Guatemala | 0.4 /100 | #258 | Tragic 78.7% |
| Tsimshian | 0.4 /100 | #259 | Tragic 78.7% |
| Immigrants | Fiji | 0.3 /100 | #260 | Tragic 78.6% |
| Whites/Caucasians | 0.2 /100 | #261 | Tragic 78.5% |
| Fijians | 0.1 /100 | #262 | Tragic 78.4% |
| Pennsylvania Germans | 0.1 /100 | #263 | Tragic 78.4% |
| Spaniards | 0.1 /100 | #264 | Tragic 78.4% |
| British West Indians | 0.1 /100 | #265 | Tragic 78.4% |
Demographics Similar to Immigrants from Bosnia and Herzegovina by In Labor Force | Age 20-64
In terms of in labor force | age 20-64, the demographic groups most similar to Immigrants from Bosnia and Herzegovina are Sudanese (80.8%, a difference of 0.0%), Immigrants from Morocco (80.8%, a difference of 0.010%), Kenyan (80.8%, a difference of 0.020%), Immigrants from Serbia (80.8%, a difference of 0.040%), and Liberian (80.9%, a difference of 0.080%).
| Demographics | Rating | Rank | In Labor Force | Age 20-64 |
| Immigrants | Nepal | 100.0 /100 | #16 | Exceptional 81.1% |
| Norwegians | 100.0 /100 | #17 | Exceptional 81.0% |
| Immigrants | Bulgaria | 100.0 /100 | #18 | Exceptional 81.0% |
| Zimbabweans | 100.0 /100 | #19 | Exceptional 81.0% |
| Thais | 100.0 /100 | #20 | Exceptional 80.9% |
| Liberians | 100.0 /100 | #21 | Exceptional 80.9% |
| Sudanese | 100.0 /100 | #22 | Exceptional 80.8% |
| Immigrants | Bosnia and Herzegovina | 100.0 /100 | #23 | Exceptional 80.8% |
| Immigrants | Morocco | 100.0 /100 | #24 | Exceptional 80.8% |
| Kenyans | 100.0 /100 | #25 | Exceptional 80.8% |
| Immigrants | Serbia | 100.0 /100 | #26 | Exceptional 80.8% |
| Immigrants | Kenya | 99.9 /100 | #27 | Exceptional 80.7% |
| Immigrants | Uganda | 99.9 /100 | #28 | Exceptional 80.7% |
| Immigrants | South Central Asia | 99.9 /100 | #29 | Exceptional 80.7% |
| Immigrants | North Macedonia | 99.9 /100 | #30 | Exceptional 80.7% |