Immigrants from Guatemala vs Black/African American In Labor Force | Age 20-24
COMPARE
Immigrants from Guatemala
Black/African American
In Labor Force | Age 20-24
In Labor Force | Age 20-24 Comparison
Immigrants from Guatemala
Blacks/African Americans
75.3%
IN LABOR FORCE | AGE 20-24
71.9/ 100
METRIC RATING
155th/ 347
METRIC RANK
73.9%
IN LABOR FORCE | AGE 20-24
1.3/ 100
METRIC RATING
249th/ 347
METRIC RANK
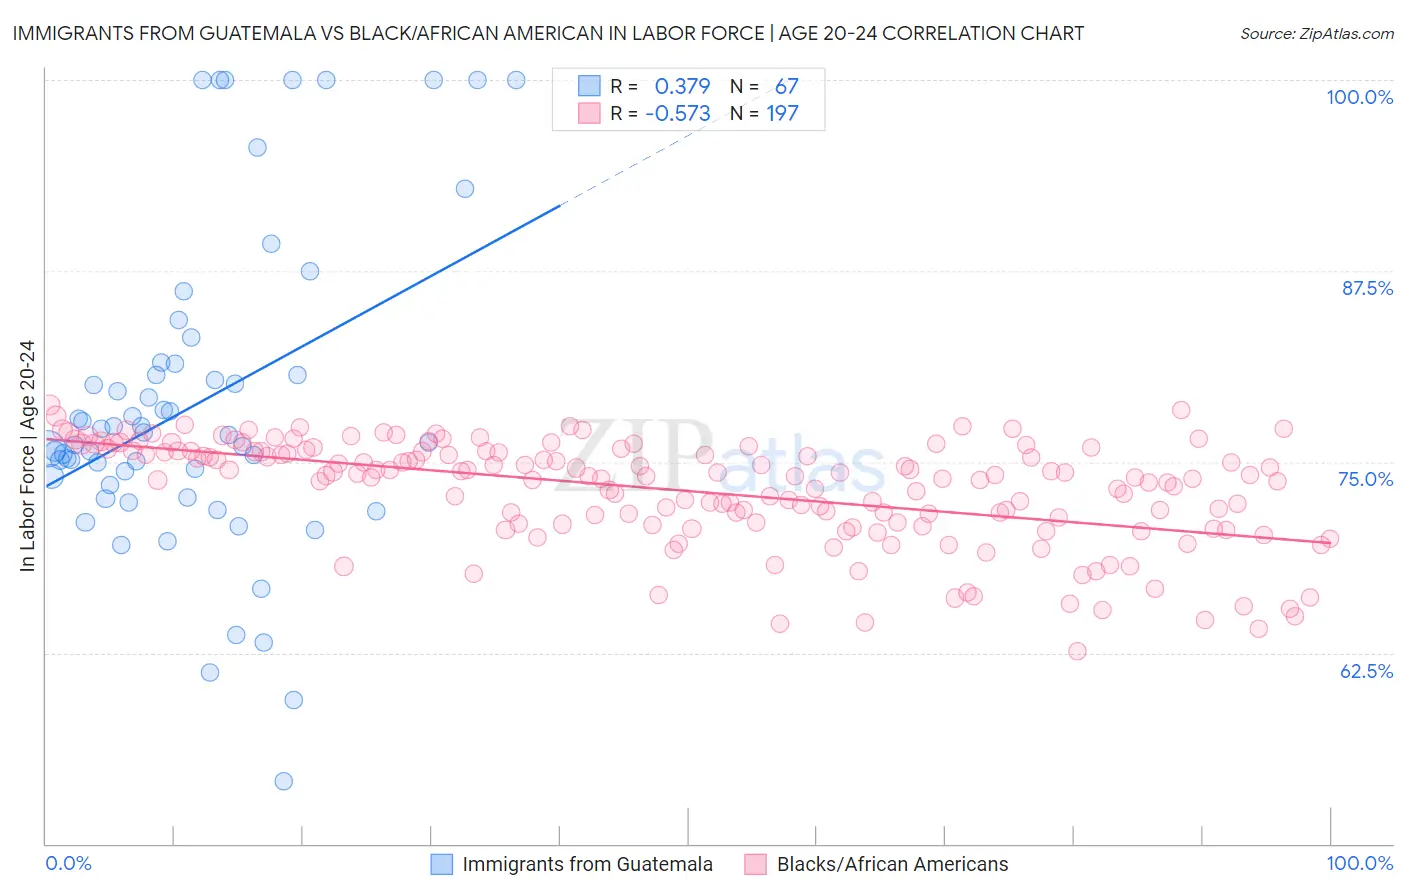
Immigrants from Guatemala vs Black/African American In Labor Force | Age 20-24 Correlation Chart
The statistical analysis conducted on geographies consisting of 377,197,138 people shows a mild positive correlation between the proportion of Immigrants from Guatemala and labor force participation rate among population between the ages 20 and 24 in the United States with a correlation coefficient (R) of 0.379 and weighted average of 75.3%. Similarly, the statistical analysis conducted on geographies consisting of 564,749,876 people shows a substantial negative correlation between the proportion of Blacks/African Americans and labor force participation rate among population between the ages 20 and 24 in the United States with a correlation coefficient (R) of -0.573 and weighted average of 73.9%, a difference of 2.0%.
In Labor Force | Age 20-24 Correlation Summary
| Measurement | Immigrants from Guatemala | Black/African American |
| Minimum | 54.1% | 62.6% |
| Maximum | 100.0% | 78.7% |
| Range | 45.9% | 16.1% |
| Mean | 78.8% | 73.1% |
| Median | 76.8% | 74.1% |
| Interquartile 25% (IQ1) | 73.5% | 71.0% |
| Interquartile 75% (IQ3) | 81.5% | 75.7% |
| Interquartile Range (IQR) | 7.9% | 4.7% |
| Standard Deviation (Sample) | 10.4% | 3.4% |
| Standard Deviation (Population) | 10.3% | 3.4% |
Similar Demographics by In Labor Force | Age 20-24
Demographics Similar to Immigrants from Guatemala by In Labor Force | Age 20-24
In terms of in labor force | age 20-24, the demographic groups most similar to Immigrants from Guatemala are Immigrants from El Salvador (75.3%, a difference of 0.0%), Guatemalan (75.3%, a difference of 0.010%), Osage (75.3%, a difference of 0.010%), Immigrants from Western Europe (75.3%, a difference of 0.010%), and Immigrants from Bolivia (75.3%, a difference of 0.020%).
| Demographics | Rating | Rank | In Labor Force | Age 20-24 |
| Immigrants | Cambodia | 76.7 /100 | #148 | Good 75.4% |
| Ugandans | 76.1 /100 | #149 | Good 75.4% |
| Salvadorans | 74.8 /100 | #150 | Good 75.3% |
| Paiute | 74.1 /100 | #151 | Good 75.3% |
| Lebanese | 73.5 /100 | #152 | Good 75.3% |
| Guatemalans | 72.3 /100 | #153 | Good 75.3% |
| Osage | 72.3 /100 | #154 | Good 75.3% |
| Immigrants | Guatemala | 71.9 /100 | #155 | Good 75.3% |
| Immigrants | El Salvador | 71.7 /100 | #156 | Good 75.3% |
| Immigrants | Western Europe | 71.5 /100 | #157 | Good 75.3% |
| Immigrants | Bolivia | 71.0 /100 | #158 | Good 75.3% |
| South American Indians | 69.0 /100 | #159 | Good 75.3% |
| Japanese | 68.7 /100 | #160 | Good 75.3% |
| New Zealanders | 65.4 /100 | #161 | Good 75.2% |
| Immigrants | Romania | 64.6 /100 | #162 | Good 75.2% |
Demographics Similar to Blacks/African Americans by In Labor Force | Age 20-24
In terms of in labor force | age 20-24, the demographic groups most similar to Blacks/African Americans are Immigrants from Belgium (73.9%, a difference of 0.0%), Immigrants from Egypt (73.8%, a difference of 0.020%), Immigrants from Kazakhstan (73.8%, a difference of 0.040%), Colville (73.9%, a difference of 0.050%), and Immigrants from Saudi Arabia (73.9%, a difference of 0.050%).
| Demographics | Rating | Rank | In Labor Force | Age 20-24 |
| Thais | 2.1 /100 | #242 | Tragic 74.0% |
| Immigrants | Syria | 1.9 /100 | #243 | Tragic 74.0% |
| Immigrants | South Central Asia | 1.9 /100 | #244 | Tragic 74.0% |
| Turks | 1.8 /100 | #245 | Tragic 73.9% |
| Immigrants | Panama | 1.6 /100 | #246 | Tragic 73.9% |
| Colville | 1.5 /100 | #247 | Tragic 73.9% |
| Immigrants | Saudi Arabia | 1.5 /100 | #248 | Tragic 73.9% |
| Blacks/African Americans | 1.3 /100 | #249 | Tragic 73.9% |
| Immigrants | Belgium | 1.3 /100 | #250 | Tragic 73.9% |
| Immigrants | Egypt | 1.2 /100 | #251 | Tragic 73.8% |
| Immigrants | Kazakhstan | 1.1 /100 | #252 | Tragic 73.8% |
| Arapaho | 1.0 /100 | #253 | Tragic 73.8% |
| Ute | 1.0 /100 | #254 | Tragic 73.8% |
| Immigrants | Pakistan | 0.9 /100 | #255 | Tragic 73.8% |
| Spanish American Indians | 0.8 /100 | #256 | Tragic 73.7% |