Immigrants from Grenada vs Immigrants from Kuwait In Labor Force | Age 20-64

COMPARE

Immigrants from Grenada
Race
Ancestry
AfghanAfricanAlaska NativeAlaskan AthabascanAlbanianAleutAlsatianAmericanApacheArabArapahoArgentineanArmenianAssyrian/Chaldean/SyriacAustralianAustrianBahamianBangladeshiBarbadianBasqueBelgianBelizeanBermudanBhutaneseBlackfeetBolivianBrazilianBritishBritish West IndianBulgarianBurmeseCajunCambodianCanadianCape VerdeanCarpatho RusynCelticCentral AmericanCentral American IndianCherokeeCheyenneChickasawChileanChineseChippewaChoctawColombianColvilleComancheCosta RicanCreeCreekCroatianCrowCubanCypriotCzechCzechoslovakianDanishDelawareDominicanDutchDutch West IndianEastern EuropeanEcuadorianEgyptianEnglishEstonianEthiopianEuropeanFijianFilipinoFinnishFrenchFrench American IndianFrench CanadianGermanGerman RussianGhanaianGreekGuamanian/ChamorroGuatemalanGuyaneseHaitianHmongHonduranHopiHoumaHungarianIcelanderIndian (Asian)IndonesianInupiatIranianIraqiIrishIroquoisIsraeliItalianJamaicanJapaneseJordanianKenyanKiowaKoreanLaotianLatvianLebaneseLiberianLithuanianLumbeeLuxembourgerMacedonianMalaysianMalteseMarshalleseMenomineeMexicanMexican American IndianMongolianMoroccanNative HawaiianNavajoNepaleseNew ZealanderNicaraguanNigerianNorthern EuropeanNorwegianOkinawanOsageOttawaPaiutePakistaniPalestinianPanamanianParaguayanPennsylvania GermanPeruvianPimaPolishPortuguesePotawatomiPuebloPuerto RicanPuget Sound SalishRomanianRussianSalvadoranSamoanScandinavianScotch-IrishScottishSeminoleSenegaleseSerbianShoshoneSierra LeoneanSiouxSlavicSlovakSloveneSomaliSouth AfricanSouth AmericanSouth American IndianSoviet UnionSpaniardSpanishSpanish AmericanSpanish American IndianSri LankanSubsaharan AfricanSudaneseSwedishSwissSyrianTaiwaneseThaiTlingit-HaidaTohono O'OdhamTonganTrinidadian and TobagonianTsimshianTurkishU.S. Virgin IslanderUgandanUkrainianUruguayanUteVenezuelanVietnameseWelshWest IndianYakamaYaquiYugoslavianYumanYup'ikZimbabwean
Immigration
NonimmigrantsImmigrantsAfghanistanAfricaAlbaniaArgentinaArmeniaAsiaAustraliaAustriaBahamasBangladeshBarbadosBelarusBelgiumBelizeBoliviaBosnia and HerzegovinaBrazilBulgariaBurma/MyanmarCabo VerdeCambodiaCameroonCanadaCaribbeanCentral AmericaChileChinaColombiaCongoCosta RicaCroatiaCubaCzechoslovakiaDenmarkDominicaDominican RepublicEastern AfricaEastern AsiaEastern EuropeEcuadorEgyptEl SalvadorEnglandEritreaEthiopiaEuropeFijiFranceGermanyGhanaGreeceGrenadaGuatemalaGuyanaHaitiHondurasHong KongHungaryIndiaIndonesiaIranIraqIrelandIsraelItalyJamaicaJapanJordanKazakhstanKenyaKoreaLaosLatin AmericaLatviaLebanonLiberiaLithuaniaMalaysiaMexicoMicronesiaMiddle AfricaMoldovaMoroccoNepalNetherlandsNicaraguaNigeriaNorth AmericaNorth MacedoniaNorthern AfricaNorthern EuropeNorwayOceaniaPakistanPanamaPeruPhilippinesPolandPortugalRomaniaRussiaSaudi ArabiaScotlandSenegalSerbiaSierra LeoneSingaporeSomaliaSouth AfricaSouth AmericaSouth Central AsiaSouth Eastern AsiaSouthern EuropeSpainSri LankaSt. Vincent and the GrenadinesSudanSwedenSwitzerlandSyriaTaiwanThailandTrinidad and TobagoTurkeyUgandaUkraineUruguayUzbekistanVenezuelaVietnamWest IndiesWestern AfricaWestern AsiaWestern EuropeYemenZaireZimbabweAzores
Immigrants from Kuwait
Race
Ancestry
AfghanAfricanAlaska NativeAlaskan AthabascanAlbanianAleutAlsatianAmericanApacheArabArapahoArgentineanArmenianAssyrian/Chaldean/SyriacAustralianAustrianBahamianBangladeshiBarbadianBasqueBelgianBelizeanBermudanBhutaneseBlackfeetBolivianBrazilianBritishBritish West IndianBulgarianBurmeseCajunCambodianCanadianCape VerdeanCarpatho RusynCelticCentral AmericanCentral American IndianCherokeeCheyenneChickasawChileanChineseChippewaChoctawColombianColvilleComancheCosta RicanCreeCreekCroatianCrowCubanCypriotCzechCzechoslovakianDanishDelawareDominicanDutchDutch West IndianEastern EuropeanEcuadorianEgyptianEnglishEstonianEthiopianEuropeanFijianFilipinoFinnishFrenchFrench American IndianFrench CanadianGermanGerman RussianGhanaianGreekGuamanian/ChamorroGuatemalanGuyaneseHaitianHmongHonduranHopiHoumaHungarianIcelanderIndian (Asian)IndonesianInupiatIranianIraqiIrishIroquoisIsraeliItalianJamaicanJapaneseJordanianKenyanKiowaKoreanLaotianLatvianLebaneseLiberianLithuanianLumbeeLuxembourgerMacedonianMalaysianMalteseMarshalleseMenomineeMexicanMexican American IndianMongolianMoroccanNative HawaiianNavajoNepaleseNew ZealanderNicaraguanNigerianNorthern EuropeanNorwegianOkinawanOsageOttawaPaiutePakistaniPalestinianPanamanianParaguayanPennsylvania GermanPeruvianPimaPolishPortuguesePotawatomiPuebloPuerto RicanPuget Sound SalishRomanianRussianSalvadoranSamoanScandinavianScotch-IrishScottishSeminoleSenegaleseSerbianShoshoneSierra LeoneanSiouxSlavicSlovakSloveneSomaliSouth AfricanSouth AmericanSouth American IndianSoviet UnionSpaniardSpanishSpanish AmericanSpanish American IndianSri LankanSubsaharan AfricanSudaneseSwedishSwissSyrianTaiwaneseThaiTlingit-HaidaTohono O'OdhamTonganTrinidadian and TobagonianTsimshianTurkishU.S. Virgin IslanderUgandanUkrainianUruguayanUteVenezuelanVietnameseWelshWest IndianYakamaYaquiYugoslavianYumanYup'ikZimbabwean
Immigration
NonimmigrantsImmigrantsAfghanistanAfricaAlbaniaArgentinaArmeniaAsiaAustraliaAustriaBahamasBangladeshBarbadosBelarusBelgiumBelizeBoliviaBosnia and HerzegovinaBrazilBulgariaBurma/MyanmarCabo VerdeCambodiaCameroonCanadaCaribbeanCentral AmericaChileChinaColombiaCongoCosta RicaCroatiaCubaCzechoslovakiaDenmarkDominicaDominican RepublicEastern AfricaEastern AsiaEastern EuropeEcuadorEgyptEl SalvadorEnglandEritreaEthiopiaEuropeFijiFranceGermanyGhanaGreeceGuatemalaGuyanaHaitiHondurasHong KongHungaryIndiaIndonesiaIranIraqIrelandIsraelItalyJamaicaJapanJordanKazakhstanKenyaKoreaKuwaitLaosLatin AmericaLatviaLebanonLiberiaLithuaniaMalaysiaMexicoMicronesiaMiddle AfricaMoldovaMoroccoNepalNetherlandsNicaraguaNigeriaNorth AmericaNorth MacedoniaNorthern AfricaNorthern EuropeNorwayOceaniaPakistanPanamaPeruPhilippinesPolandPortugalRomaniaRussiaSaudi ArabiaScotlandSenegalSerbiaSierra LeoneSingaporeSomaliaSouth AfricaSouth AmericaSouth Central AsiaSouth Eastern AsiaSouthern EuropeSpainSri LankaSt. Vincent and the GrenadinesSudanSwedenSwitzerlandSyriaTaiwanThailandTrinidad and TobagoTurkeyUgandaUkraineUruguayUzbekistanVenezuelaVietnamWest IndiesWestern AfricaWestern AsiaWestern EuropeYemenZaireZimbabweAzores
In Labor Force | Age 20-64
Income
Poverty
Unemployment
Labor Participation
Family Structure
Vehicle Availability
Education Level
Disability

In Labor Force | Age 20-64 Comparison

Immigrants from Grenada

Immigrants from Kuwait

Tragic
Exceptional
77.7%
IN LABOR FORCE | AGE 20-64
0.0/ 100
METRIC RATING
295th/ 347
METRIC RANK
80.0%
IN LABOR FORCE | AGE 20-64
92.2/ 100
METRIC RATING
121st/ 347
METRIC RANK

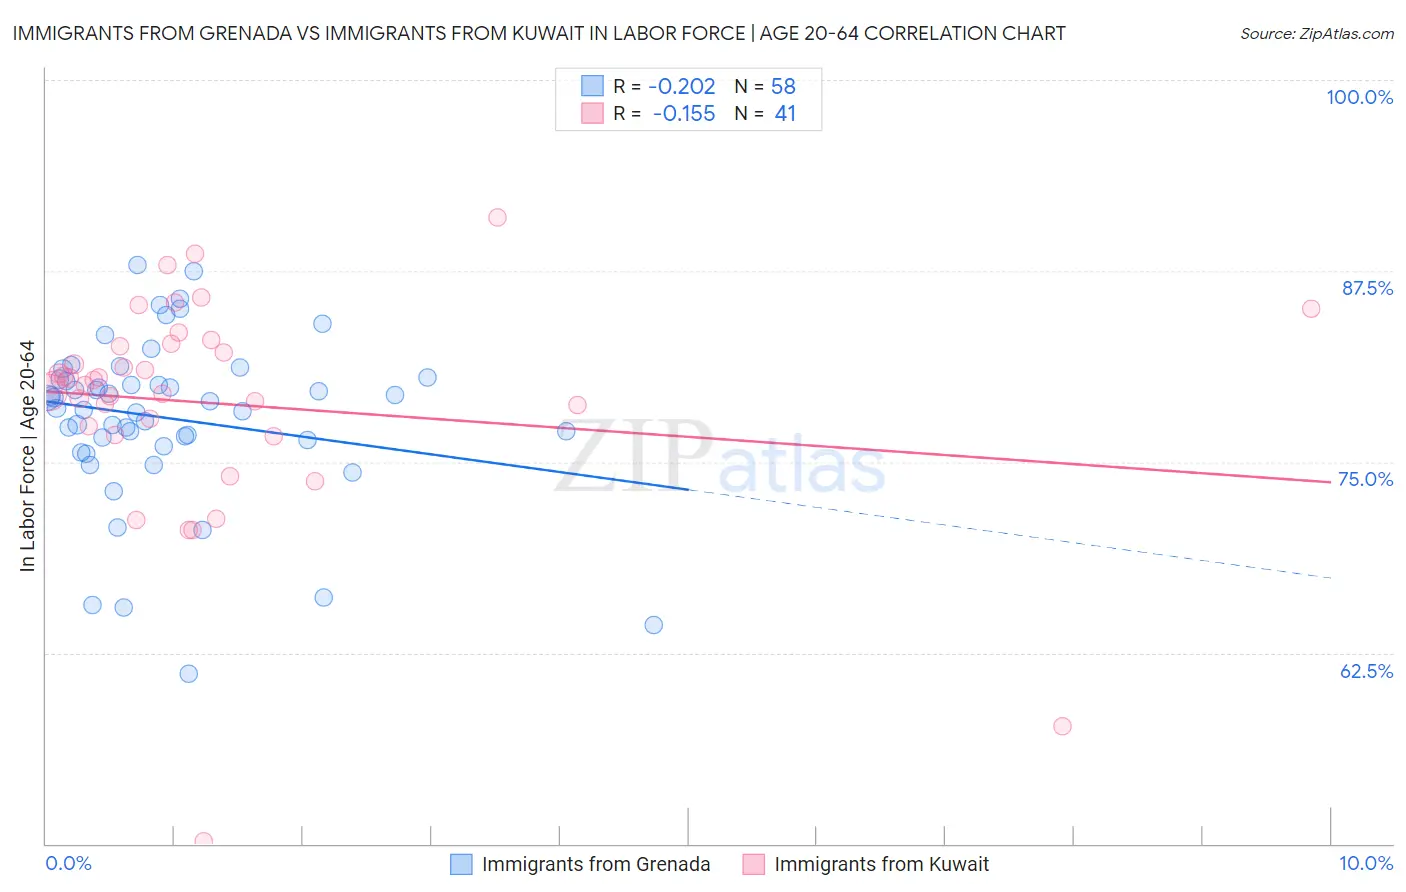
Immigrants from Grenada vs Immigrants from Kuwait In Labor Force | Age 20-64 Correlation Chart

The statistical analysis conducted on geographies consisting of 67,201,096 people shows a weak negative correlation between the proportion of Immigrants from Grenada and labor force participation rate among population between the ages 20 and 64 in the United States with a correlation coefficient (R) of -0.202 and weighted average of 77.7%. Similarly, the statistical analysis conducted on geographies consisting of 136,914,961 people shows a poor negative correlation between the proportion of Immigrants from Kuwait and labor force participation rate among population between the ages 20 and 64 in the United States with a correlation coefficient (R) of -0.155 and weighted average of 80.0%, a difference of 2.9%.
Immigrants from Grenada vs Immigrants from Kuwait In Labor Force | Age 20-64

In Labor Force | Age 20-64 Correlation Summary

MeasurementImmigrants from GrenadaImmigrants from Kuwait
Minimum61.1%50.2%
Maximum87.9%91.0%
Range26.8%40.8%
Mean77.9%78.8%
Median78.8%80.2%
Interquartile 25% (IQ1)76.4%77.0%
Interquartile 75% (IQ3)80.4%82.7%
Interquartile Range (IQR)4.0%5.7%
Standard Deviation (Sample)5.4%7.4%
Standard Deviation (Population)5.4%7.3%

Similar Demographics by In Labor Force | Age 20-64

Demographics Similar to Immigrants from Grenada by In Labor Force | Age 20-64

In terms of in labor force | age 20-64, the demographic groups most similar to Immigrants from Grenada are Immigrants from Central America (77.7%, a difference of 0.030%), Immigrants from Dominican Republic (77.7%, a difference of 0.030%), Dominican (77.7%, a difference of 0.040%), Cree (77.7%, a difference of 0.050%), and Hispanic or Latino (77.6%, a difference of 0.11%).
DemographicsRating | RankIn Labor Force | Age 20-64
Hmong
0.0
/100
|
#288
Tragic
77.9%
Africans
0.0
/100
|
#289
Tragic
77.9%
Immigrants | Bangladesh
0.0
/100
|
#290
Tragic
77.9%
Spanish Americans
0.0
/100
|
#291
Tragic
77.8%
Immigrants | Azores
0.0
/100
|
#292
Tragic
77.8%
Delaware
0.0
/100
|
#293
Tragic
77.8%
Immigrants | Central America
0.0
/100
|
#294
Tragic
77.7%
Immigrants | Grenada
0.0
/100
|
#295
Tragic
77.7%
Immigrants | Dominican Republic
0.0
/100
|
#296
Tragic
77.7%
Dominicans
0.0
/100
|
#297
Tragic
77.7%
Cree
0.0
/100
|
#298
Tragic
77.7%
Hispanics or Latinos
0.0
/100
|
#299
Tragic
77.6%
Spanish American Indians
0.0
/100
|
#300
Tragic
77.6%
Nepalese
0.0
/100
|
#301
Tragic
77.5%
Iroquois
0.0
/100
|
#302
Tragic
77.5%

Demographics Similar to Immigrants from Kuwait by In Labor Force | Age 20-64

In terms of in labor force | age 20-64, the demographic groups most similar to Immigrants from Kuwait are Immigrants from Vietnam (80.0%, a difference of 0.010%), Cape Verdean (80.0%, a difference of 0.010%), Immigrants from Taiwan (80.0%, a difference of 0.010%), Maltese (80.0%, a difference of 0.010%), and Mongolian (79.9%, a difference of 0.010%).
DemographicsRating | RankIn Labor Force | Age 20-64
Argentineans
93.8
/100
|
#114
Exceptional
80.0%
Bermudans
93.3
/100
|
#115
Exceptional
80.0%
Immigrants | Western Africa
93.1
/100
|
#116
Exceptional
80.0%
Immigrants | Vietnam
92.7
/100
|
#117
Exceptional
80.0%
Cape Verdeans
92.7
/100
|
#118
Exceptional
80.0%
Immigrants | Taiwan
92.5
/100
|
#119
Exceptional
80.0%
Maltese
92.4
/100
|
#120
Exceptional
80.0%
Immigrants | Kuwait
92.2
/100
|
#121
Exceptional
80.0%
Mongolians
92.0
/100
|
#122
Exceptional
79.9%
Immigrants | Russia
91.8
/100
|
#123
Exceptional
79.9%
Immigrants | Europe
91.6
/100
|
#124
Exceptional
79.9%
Danes
91.5
/100
|
#125
Exceptional
79.9%
Immigrants | France
90.7
/100
|
#126
Exceptional
79.9%
Immigrants | Czechoslovakia
89.7
/100
|
#127
Excellent
79.9%
Immigrants | Eastern Asia
89.4
/100
|
#128
Excellent
79.9%