Immigrants from Ghana vs Immigrants from Burma/Myanmar In Labor Force | Age 30-34

COMPARE

Immigrants from Ghana
Race
Ancestry
AfghanAfricanAlaska NativeAlaskan AthabascanAlbanianAleutAlsatianAmericanApacheArabArapahoArgentineanArmenianAssyrian/Chaldean/SyriacAustralianAustrianBahamianBangladeshiBarbadianBasqueBelgianBelizeanBermudanBhutaneseBlackfeetBolivianBrazilianBritishBritish West IndianBulgarianBurmeseCajunCambodianCanadianCape VerdeanCarpatho RusynCelticCentral AmericanCentral American IndianCherokeeCheyenneChickasawChileanChineseChippewaChoctawColombianColvilleComancheCosta RicanCreeCreekCroatianCrowCubanCypriotCzechCzechoslovakianDanishDelawareDominicanDutchDutch West IndianEastern EuropeanEcuadorianEgyptianEnglishEstonianEthiopianEuropeanFijianFilipinoFinnishFrenchFrench American IndianFrench CanadianGermanGerman RussianGhanaianGreekGuamanian/ChamorroGuatemalanGuyaneseHaitianHmongHonduranHopiHoumaHungarianIcelanderIndian (Asian)IndonesianInupiatIranianIraqiIrishIroquoisIsraeliItalianJamaicanJapaneseJordanianKenyanKiowaKoreanLaotianLatvianLebaneseLiberianLithuanianLumbeeLuxembourgerMacedonianMalaysianMalteseMarshalleseMenomineeMexicanMexican American IndianMongolianMoroccanNative HawaiianNavajoNepaleseNew ZealanderNicaraguanNigerianNorthern EuropeanNorwegianOkinawanOsageOttawaPaiutePakistaniPalestinianPanamanianParaguayanPennsylvania GermanPeruvianPimaPolishPortuguesePotawatomiPuebloPuerto RicanPuget Sound SalishRomanianRussianSalvadoranSamoanScandinavianScotch-IrishScottishSeminoleSenegaleseSerbianShoshoneSierra LeoneanSiouxSlavicSlovakSloveneSomaliSouth AfricanSouth AmericanSouth American IndianSoviet UnionSpaniardSpanishSpanish AmericanSpanish American IndianSri LankanSubsaharan AfricanSudaneseSwedishSwissSyrianTaiwaneseThaiTlingit-HaidaTohono O'OdhamTonganTrinidadian and TobagonianTsimshianTurkishU.S. Virgin IslanderUgandanUkrainianUruguayanUteVenezuelanVietnameseWelshWest IndianYakamaYaquiYugoslavianYumanYup'ikZimbabwean
Immigration
NonimmigrantsImmigrantsAfghanistanAfricaAlbaniaArgentinaArmeniaAsiaAustraliaAustriaBahamasBangladeshBarbadosBelarusBelgiumBelizeBoliviaBosnia and HerzegovinaBrazilBulgariaCabo VerdeCambodiaCameroonCanadaCaribbeanCentral AmericaChileChinaColombiaCongoCosta RicaCroatiaCubaCzechoslovakiaDenmarkDominicaDominican RepublicEastern AfricaEastern AsiaEastern EuropeEcuadorEgyptEl SalvadorEnglandEritreaEthiopiaEuropeFijiFranceGermanyGhanaGreeceGrenadaGuatemalaGuyanaHaitiHondurasHong KongHungaryIndiaIndonesiaIranIraqIrelandIsraelItalyJamaicaJapanJordanKazakhstanKenyaKoreaKuwaitLaosLatin AmericaLatviaLebanonLiberiaLithuaniaMalaysiaMexicoMicronesiaMiddle AfricaMoldovaMoroccoNepalNetherlandsNicaraguaNigeriaNorth AmericaNorth MacedoniaNorthern AfricaNorthern EuropeNorwayOceaniaPakistanPanamaPeruPhilippinesPolandPortugalRomaniaRussiaSaudi ArabiaScotlandSenegalSerbiaSierra LeoneSingaporeSomaliaSouth AfricaSouth AmericaSouth Central AsiaSouth Eastern AsiaSouthern EuropeSpainSri LankaSt. Vincent and the GrenadinesSudanSwedenSwitzerlandSyriaTaiwanThailandTrinidad and TobagoTurkeyUgandaUkraineUruguayUzbekistanVenezuelaVietnamWest IndiesWestern AfricaWestern AsiaWestern EuropeYemenZaireZimbabweAzores
Immigrants from Burma/Myanmar
Race
Ancestry
AfghanAfricanAlaska NativeAlaskan AthabascanAlbanianAleutAlsatianAmericanApacheArabArapahoArgentineanArmenianAssyrian/Chaldean/SyriacAustralianAustrianBahamianBangladeshiBarbadianBasqueBelgianBelizeanBermudanBhutaneseBlackfeetBolivianBrazilianBritishBritish West IndianBulgarianBurmeseCajunCambodianCanadianCape VerdeanCarpatho RusynCelticCentral AmericanCentral American IndianCherokeeCheyenneChickasawChileanChineseChippewaChoctawColombianColvilleComancheCosta RicanCreeCreekCroatianCrowCubanCypriotCzechCzechoslovakianDanishDelawareDominicanDutchDutch West IndianEastern EuropeanEcuadorianEgyptianEnglishEstonianEthiopianEuropeanFijianFilipinoFinnishFrenchFrench American IndianFrench CanadianGermanGerman RussianGhanaianGreekGuamanian/ChamorroGuatemalanGuyaneseHaitianHmongHonduranHopiHoumaHungarianIcelanderIndian (Asian)IndonesianInupiatIranianIraqiIrishIroquoisIsraeliItalianJamaicanJapaneseJordanianKenyanKiowaKoreanLaotianLatvianLebaneseLiberianLithuanianLumbeeLuxembourgerMacedonianMalaysianMalteseMarshalleseMenomineeMexicanMexican American IndianMongolianMoroccanNative HawaiianNavajoNepaleseNew ZealanderNicaraguanNigerianNorthern EuropeanNorwegianOkinawanOsageOttawaPaiutePakistaniPalestinianPanamanianParaguayanPennsylvania GermanPeruvianPimaPolishPortuguesePotawatomiPuebloPuerto RicanPuget Sound SalishRomanianRussianSalvadoranSamoanScandinavianScotch-IrishScottishSeminoleSenegaleseSerbianShoshoneSierra LeoneanSiouxSlavicSlovakSloveneSomaliSouth AfricanSouth AmericanSouth American IndianSoviet UnionSpaniardSpanishSpanish AmericanSpanish American IndianSri LankanSubsaharan AfricanSudaneseSwedishSwissSyrianTaiwaneseThaiTlingit-HaidaTohono O'OdhamTonganTrinidadian and TobagonianTsimshianTurkishU.S. Virgin IslanderUgandanUkrainianUruguayanUteVenezuelanVietnameseWelshWest IndianYakamaYaquiYugoslavianYumanYup'ikZimbabwean
Immigration
NonimmigrantsImmigrantsAfghanistanAfricaAlbaniaArgentinaArmeniaAsiaAustraliaAustriaBahamasBangladeshBarbadosBelarusBelgiumBelizeBoliviaBosnia and HerzegovinaBrazilBulgariaBurma/MyanmarCabo VerdeCambodiaCameroonCanadaCaribbeanCentral AmericaChileChinaColombiaCongoCosta RicaCroatiaCubaCzechoslovakiaDenmarkDominicaDominican RepublicEastern AfricaEastern AsiaEastern EuropeEcuadorEgyptEl SalvadorEnglandEritreaEthiopiaEuropeFijiFranceGermanyGreeceGrenadaGuatemalaGuyanaHaitiHondurasHong KongHungaryIndiaIndonesiaIranIraqIrelandIsraelItalyJamaicaJapanJordanKazakhstanKenyaKoreaKuwaitLaosLatin AmericaLatviaLebanonLiberiaLithuaniaMalaysiaMexicoMicronesiaMiddle AfricaMoldovaMoroccoNepalNetherlandsNicaraguaNigeriaNorth AmericaNorth MacedoniaNorthern AfricaNorthern EuropeNorwayOceaniaPakistanPanamaPeruPhilippinesPolandPortugalRomaniaRussiaSaudi ArabiaScotlandSenegalSerbiaSierra LeoneSingaporeSomaliaSouth AfricaSouth AmericaSouth Central AsiaSouth Eastern AsiaSouthern EuropeSpainSri LankaSt. Vincent and the GrenadinesSudanSwedenSwitzerlandSyriaTaiwanThailandTrinidad and TobagoTurkeyUgandaUkraineUruguayUzbekistanVenezuelaVietnamWest IndiesWestern AfricaWestern AsiaWestern EuropeYemenZaireZimbabweAzores
In Labor Force | Age 30-34
Income
Poverty
Unemployment
Labor Participation
Family Structure
Vehicle Availability
Education Level
Disability

In Labor Force | Age 30-34 Comparison

Immigrants from Ghana

Immigrants from Burma/Myanmar

Exceptional
Average
85.2%
IN LABOR FORCE | AGE 30-34
96.5/ 100
METRIC RATING
104th/ 347
METRIC RANK
84.7%
IN LABOR FORCE | AGE 30-34
52.0/ 100
METRIC RATING
170th/ 347
METRIC RANK

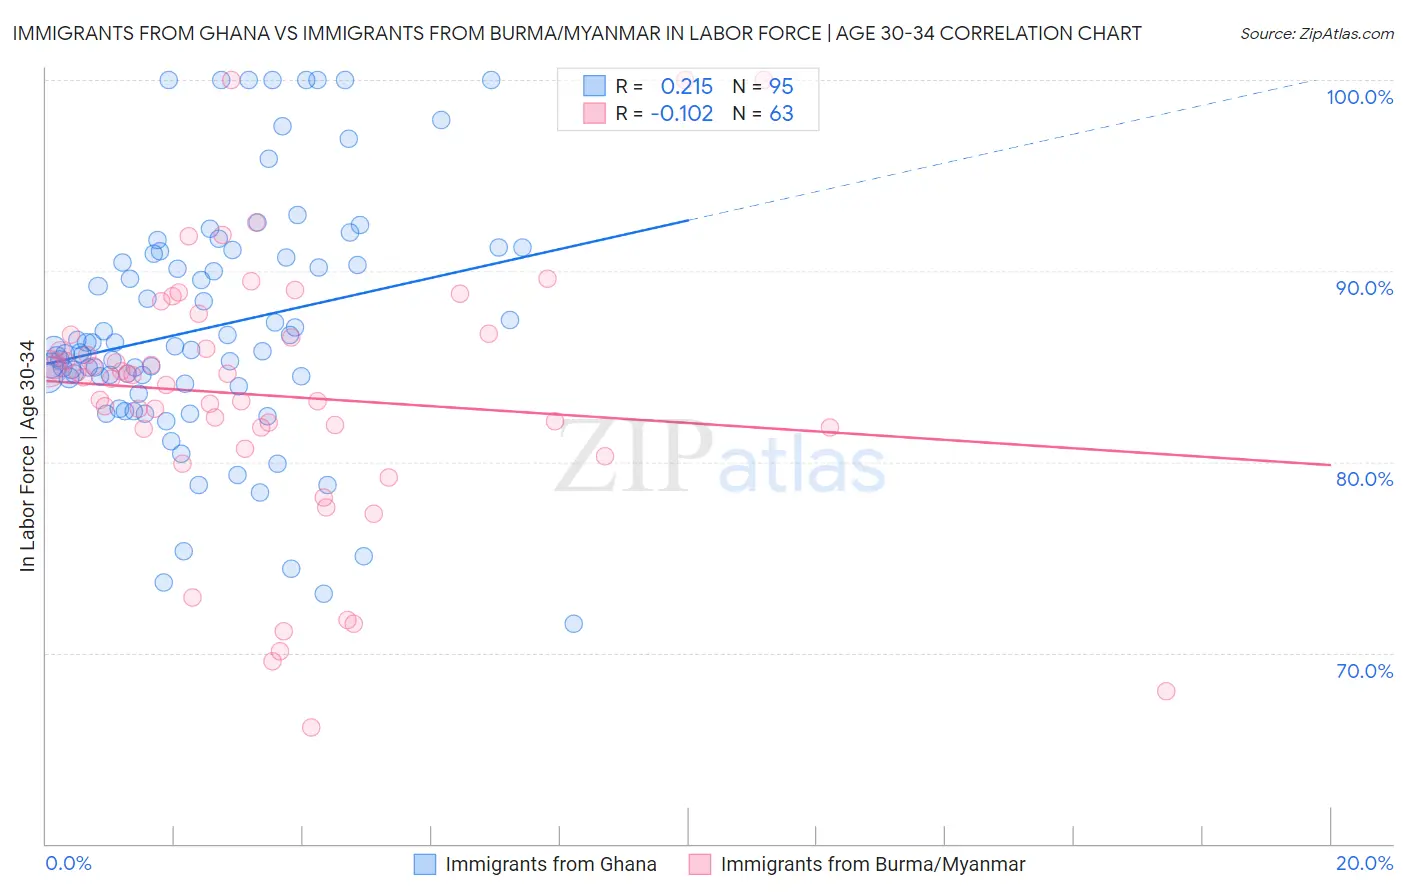
Immigrants from Ghana vs Immigrants from Burma/Myanmar In Labor Force | Age 30-34 Correlation Chart

The statistical analysis conducted on geographies consisting of 199,865,631 people shows a weak positive correlation between the proportion of Immigrants from Ghana and labor force participation rate among population between the ages 30 and 34 in the United States with a correlation coefficient (R) of 0.215 and weighted average of 85.2%. Similarly, the statistical analysis conducted on geographies consisting of 172,303,659 people shows a poor negative correlation between the proportion of Immigrants from Burma/Myanmar and labor force participation rate among population between the ages 30 and 34 in the United States with a correlation coefficient (R) of -0.102 and weighted average of 84.7%, a difference of 0.57%.
Immigrants from Ghana vs Immigrants from Burma/Myanmar In Labor Force | Age 30-34

In Labor Force | Age 30-34 Correlation Summary

MeasurementImmigrants from GhanaImmigrants from Burma/Myanmar
Minimum71.5%66.1%
Maximum100.0%100.0%
Range28.5%33.9%
Mean87.0%83.5%
Median85.8%84.4%
Interquartile 25% (IQ1)84.1%81.8%
Interquartile 75% (IQ3)90.9%86.7%
Interquartile Range (IQR)6.8%4.9%
Standard Deviation (Sample)6.4%6.9%
Standard Deviation (Population)6.4%6.9%

Similar Demographics by In Labor Force | Age 30-34

Demographics Similar to Immigrants from Ghana by In Labor Force | Age 30-34

In terms of in labor force | age 30-34, the demographic groups most similar to Immigrants from Ghana are Ukrainian (85.2%, a difference of 0.0%), Immigrants from Austria (85.2%, a difference of 0.010%), Alsatian (85.2%, a difference of 0.010%), Immigrants from Middle Africa (85.2%, a difference of 0.010%), and Immigrants from Northern Africa (85.2%, a difference of 0.010%).
DemographicsRating | RankIn Labor Force | Age 30-34
Thais
97.2
/100
|
#97
Exceptional
85.2%
Immigrants | Uganda
97.2
/100
|
#98
Exceptional
85.2%
Belgians
97.2
/100
|
#99
Exceptional
85.2%
Sudanese
97.1
/100
|
#100
Exceptional
85.2%
Immigrants | Belarus
96.9
/100
|
#101
Exceptional
85.2%
Immigrants | Austria
96.8
/100
|
#102
Exceptional
85.2%
Ukrainians
96.6
/100
|
#103
Exceptional
85.2%
Immigrants | Ghana
96.5
/100
|
#104
Exceptional
85.2%
Alsatians
96.3
/100
|
#105
Exceptional
85.2%
Immigrants | Middle Africa
96.3
/100
|
#106
Exceptional
85.2%
Immigrants | Northern Africa
96.3
/100
|
#107
Exceptional
85.2%
Immigrants | Zimbabwe
95.8
/100
|
#108
Exceptional
85.1%
Argentineans
95.8
/100
|
#109
Exceptional
85.1%
Immigrants | South Africa
95.3
/100
|
#110
Exceptional
85.1%
Immigrants | Scotland
94.9
/100
|
#111
Exceptional
85.1%

Demographics Similar to Immigrants from Burma/Myanmar by In Labor Force | Age 30-34

In terms of in labor force | age 30-34, the demographic groups most similar to Immigrants from Burma/Myanmar are Immigrants from Peru (84.7%, a difference of 0.0%), South American Indian (84.7%, a difference of 0.0%), Irish (84.7%, a difference of 0.0%), Immigrants from England (84.7%, a difference of 0.0%), and Israeli (84.7%, a difference of 0.010%).
DemographicsRating | RankIn Labor Force | Age 30-34
Immigrants | Uruguay
57.4
/100
|
#163
Average
84.7%
Icelanders
56.8
/100
|
#164
Average
84.7%
Immigrants | Western Europe
56.7
/100
|
#165
Average
84.7%
Afghans
55.2
/100
|
#166
Average
84.7%
Immigrants | South Eastern Asia
54.2
/100
|
#167
Average
84.7%
Immigrants | Peru
52.4
/100
|
#168
Average
84.7%
South American Indians
52.1
/100
|
#169
Average
84.7%
Immigrants | Burma/Myanmar
52.0
/100
|
#170
Average
84.7%
Irish
52.0
/100
|
#171
Average
84.7%
Immigrants | England
51.7
/100
|
#172
Average
84.7%
Israelis
51.1
/100
|
#173
Average
84.7%
Finns
50.0
/100
|
#174
Average
84.7%
Immigrants | South America
50.0
/100
|
#175
Average
84.7%
Immigrants | Uzbekistan
49.1
/100
|
#176
Average
84.7%
Laotians
46.9
/100
|
#177
Average
84.7%