Immigrants from Eritrea vs Immigrants from Jamaica In Labor Force | Age > 16
COMPARE
Immigrants from Eritrea
Immigrants from Jamaica
In Labor Force | Age > 16
In Labor Force | Age > 16 Comparison
Immigrants from Eritrea
Immigrants from Jamaica
68.9%
IN LABOR FORCE | AGE > 16
100.0/ 100
METRIC RATING
6th/ 347
METRIC RANK
64.7%
IN LABOR FORCE | AGE > 16
8.8/ 100
METRIC RATING
224th/ 347
METRIC RANK
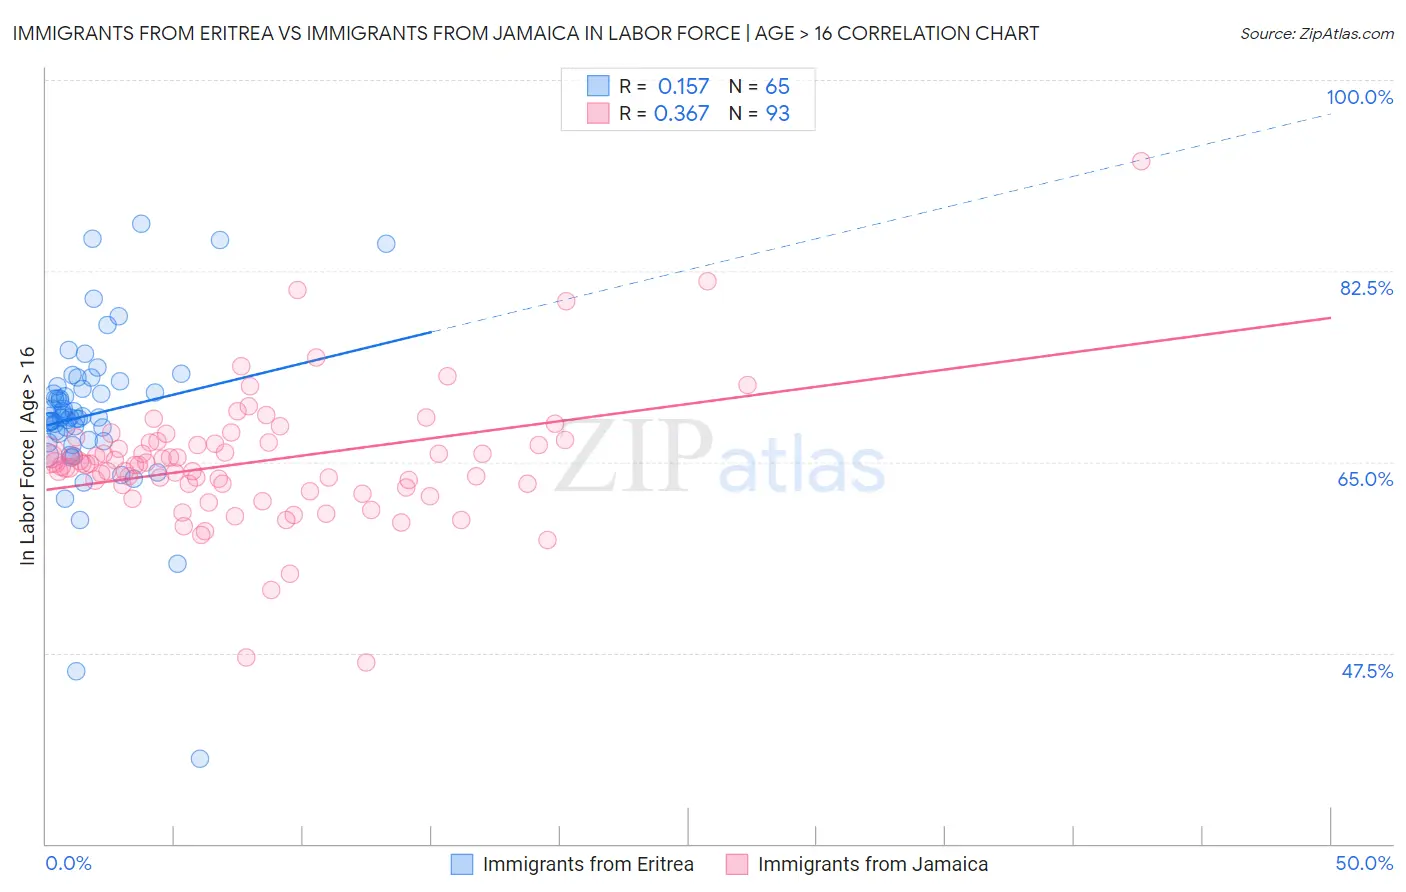
Immigrants from Eritrea vs Immigrants from Jamaica In Labor Force | Age > 16 Correlation Chart
The statistical analysis conducted on geographies consisting of 104,852,450 people shows a poor positive correlation between the proportion of Immigrants from Eritrea and labor force participation rate among population ages 16 and over in the United States with a correlation coefficient (R) of 0.157 and weighted average of 68.9%. Similarly, the statistical analysis conducted on geographies consisting of 301,819,695 people shows a mild positive correlation between the proportion of Immigrants from Jamaica and labor force participation rate among population ages 16 and over in the United States with a correlation coefficient (R) of 0.367 and weighted average of 64.7%, a difference of 6.5%.
In Labor Force | Age > 16 Correlation Summary
| Measurement | Immigrants from Eritrea | Immigrants from Jamaica |
| Minimum | 37.8% | 46.6% |
| Maximum | 86.8% | 92.6% |
| Range | 49.0% | 46.0% |
| Mean | 69.3% | 65.0% |
| Median | 69.1% | 64.8% |
| Interquartile 25% (IQ1) | 67.0% | 62.8% |
| Interquartile 75% (IQ3) | 71.8% | 66.8% |
| Interquartile Range (IQR) | 4.9% | 4.0% |
| Standard Deviation (Sample) | 7.5% | 6.1% |
| Standard Deviation (Population) | 7.5% | 6.0% |
Similar Demographics by In Labor Force | Age > 16
Demographics Similar to Immigrants from Eritrea by In Labor Force | Age > 16
In terms of in labor force | age > 16, the demographic groups most similar to Immigrants from Eritrea are Sierra Leonean (68.9%, a difference of 0.050%), Immigrants from Cameroon (68.7%, a difference of 0.25%), Immigrants from Somalia (69.1%, a difference of 0.36%), Somali (69.2%, a difference of 0.43%), and Immigrants from Sierra Leone (68.5%, a difference of 0.57%).
| Demographics | Rating | Rank | In Labor Force | Age > 16 |
| Immigrants | Ethiopia | 100.0 /100 | #1 | Exceptional 69.4% |
| Ethiopians | 100.0 /100 | #2 | Exceptional 69.3% |
| Somalis | 100.0 /100 | #3 | Exceptional 69.2% |
| Immigrants | Somalia | 100.0 /100 | #4 | Exceptional 69.1% |
| Sierra Leoneans | 100.0 /100 | #5 | Exceptional 68.9% |
| Immigrants | Eritrea | 100.0 /100 | #6 | Exceptional 68.9% |
| Immigrants | Cameroon | 100.0 /100 | #7 | Exceptional 68.7% |
| Immigrants | Sierra Leone | 100.0 /100 | #8 | Exceptional 68.5% |
| Immigrants | Eastern Africa | 100.0 /100 | #9 | Exceptional 68.5% |
| Immigrants | Bolivia | 100.0 /100 | #10 | Exceptional 68.4% |
| Bolivians | 100.0 /100 | #11 | Exceptional 68.2% |
| Sudanese | 100.0 /100 | #12 | Exceptional 68.0% |
| Immigrants | Nepal | 100.0 /100 | #13 | Exceptional 68.0% |
| Liberians | 100.0 /100 | #14 | Exceptional 67.8% |
| Immigrants | Middle Africa | 100.0 /100 | #15 | Exceptional 67.7% |
Demographics Similar to Immigrants from Jamaica by In Labor Force | Age > 16
In terms of in labor force | age > 16, the demographic groups most similar to Immigrants from Jamaica are Croatian (64.7%, a difference of 0.0%), Immigrants from Belize (64.7%, a difference of 0.010%), Hawaiian (64.7%, a difference of 0.020%), European (64.7%, a difference of 0.020%), and Polish (64.7%, a difference of 0.020%).
| Demographics | Rating | Rank | In Labor Force | Age > 16 |
| U.S. Virgin Islanders | 11.3 /100 | #217 | Poor 64.7% |
| Alsatians | 10.7 /100 | #218 | Poor 64.7% |
| Immigrants | Central America | 10.5 /100 | #219 | Poor 64.7% |
| Alaska Natives | 9.9 /100 | #220 | Tragic 64.7% |
| Immigrants | Micronesia | 9.6 /100 | #221 | Tragic 64.7% |
| Hawaiians | 9.3 /100 | #222 | Tragic 64.7% |
| Immigrants | Belize | 9.2 /100 | #223 | Tragic 64.7% |
| Immigrants | Jamaica | 8.8 /100 | #224 | Tragic 64.7% |
| Croatians | 8.8 /100 | #225 | Tragic 64.7% |
| Europeans | 8.3 /100 | #226 | Tragic 64.7% |
| Poles | 8.3 /100 | #227 | Tragic 64.7% |
| Northern Europeans | 8.2 /100 | #228 | Tragic 64.7% |
| British | 7.3 /100 | #229 | Tragic 64.7% |
| Chinese | 7.3 /100 | #230 | Tragic 64.7% |
| Immigrants | Northern Europe | 7.2 /100 | #231 | Tragic 64.7% |