Immigrants from England vs Burmese In Labor Force | Age 45-54
COMPARE
Immigrants from England
Burmese
In Labor Force | Age 45-54
In Labor Force | Age 45-54 Comparison
Immigrants from England
Burmese
82.6%
IN LABOR FORCE | AGE 45-54
32.2/ 100
METRIC RATING
185th/ 347
METRIC RANK
83.6%
IN LABOR FORCE | AGE 45-54
99.1/ 100
METRIC RATING
44th/ 347
METRIC RANK
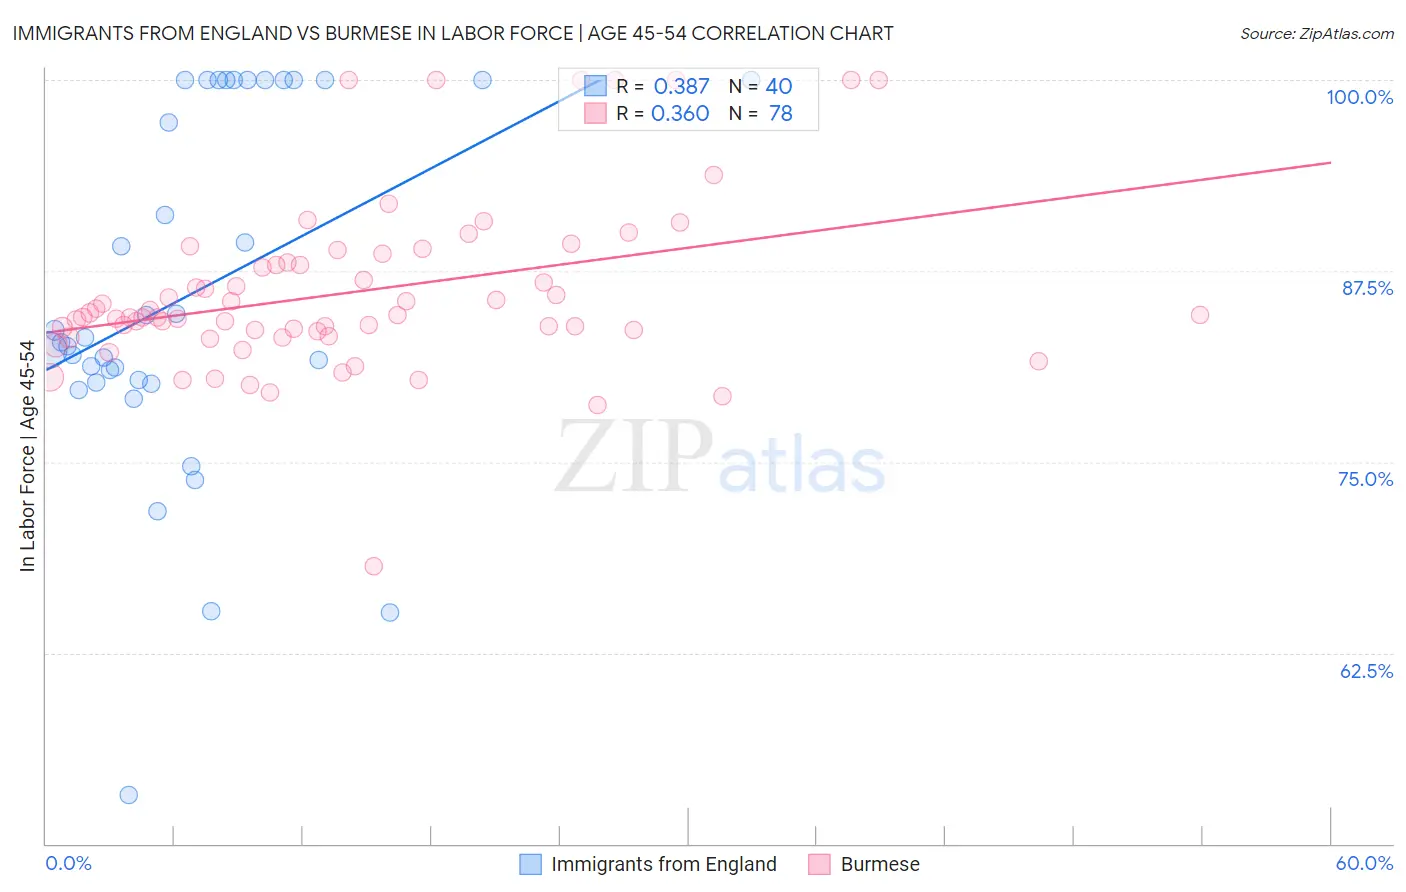
Immigrants from England vs Burmese In Labor Force | Age 45-54 Correlation Chart
The statistical analysis conducted on geographies consisting of 391,754,250 people shows a mild positive correlation between the proportion of Immigrants from England and labor force participation rate among population between the ages 45 and 54 in the United States with a correlation coefficient (R) of 0.387 and weighted average of 82.6%. Similarly, the statistical analysis conducted on geographies consisting of 464,867,064 people shows a mild positive correlation between the proportion of Burmese and labor force participation rate among population between the ages 45 and 54 in the United States with a correlation coefficient (R) of 0.360 and weighted average of 83.6%, a difference of 1.2%.
In Labor Force | Age 45-54 Correlation Summary
| Measurement | Immigrants from England | Burmese |
| Minimum | 53.2% | 68.2% |
| Maximum | 100.0% | 100.0% |
| Range | 46.8% | 31.8% |
| Mean | 86.1% | 86.1% |
| Median | 83.0% | 84.5% |
| Interquartile 25% (IQ1) | 80.3% | 83.6% |
| Interquartile 75% (IQ3) | 100.0% | 88.1% |
| Interquartile Range (IQR) | 19.7% | 4.5% |
| Standard Deviation (Sample) | 11.7% | 5.7% |
| Standard Deviation (Population) | 11.5% | 5.6% |
Similar Demographics by In Labor Force | Age 45-54
Demographics Similar to Immigrants from England by In Labor Force | Age 45-54
In terms of in labor force | age 45-54, the demographic groups most similar to Immigrants from England are New Zealander (82.6%, a difference of 0.0%), European (82.6%, a difference of 0.0%), Irish (82.6%, a difference of 0.030%), Immigrants from Costa Rica (82.6%, a difference of 0.040%), and South African (82.6%, a difference of 0.040%).
| Demographics | Rating | Rank | In Labor Force | Age 45-54 |
| Nigerians | 40.5 /100 | #178 | Average 82.7% |
| Immigrants | Switzerland | 39.4 /100 | #179 | Fair 82.7% |
| Hungarians | 38.0 /100 | #180 | Fair 82.7% |
| Israelis | 37.7 /100 | #181 | Fair 82.7% |
| Immigrants | Hungary | 37.1 /100 | #182 | Fair 82.7% |
| New Zealanders | 32.7 /100 | #183 | Fair 82.6% |
| Europeans | 32.6 /100 | #184 | Fair 82.6% |
| Immigrants | England | 32.2 /100 | #185 | Fair 82.6% |
| Irish | 29.2 /100 | #186 | Fair 82.6% |
| Immigrants | Costa Rica | 28.3 /100 | #187 | Fair 82.6% |
| South Africans | 28.0 /100 | #188 | Fair 82.6% |
| Syrians | 26.0 /100 | #189 | Fair 82.6% |
| British | 25.7 /100 | #190 | Fair 82.6% |
| Armenians | 23.2 /100 | #191 | Fair 82.5% |
| Immigrants | Iraq | 20.9 /100 | #192 | Fair 82.5% |
Demographics Similar to Burmese by In Labor Force | Age 45-54
In terms of in labor force | age 45-54, the demographic groups most similar to Burmese are Immigrants from Hong Kong (83.6%, a difference of 0.0%), Lithuanian (83.6%, a difference of 0.010%), Venezuelan (83.6%, a difference of 0.020%), Croatian (83.6%, a difference of 0.030%), and Immigrants from Poland (83.6%, a difference of 0.030%).
| Demographics | Rating | Rank | In Labor Force | Age 45-54 |
| Swedes | 99.4 /100 | #37 | Exceptional 83.7% |
| Immigrants | Venezuela | 99.4 /100 | #38 | Exceptional 83.7% |
| Immigrants | Cuba | 99.4 /100 | #39 | Exceptional 83.7% |
| Immigrants | Uganda | 99.4 /100 | #40 | Exceptional 83.7% |
| Immigrants | Korea | 99.3 /100 | #41 | Exceptional 83.7% |
| Immigrants | Moldova | 99.3 /100 | #42 | Exceptional 83.7% |
| Venezuelans | 99.2 /100 | #43 | Exceptional 83.6% |
| Burmese | 99.1 /100 | #44 | Exceptional 83.6% |
| Immigrants | Hong Kong | 99.1 /100 | #45 | Exceptional 83.6% |
| Lithuanians | 99.1 /100 | #46 | Exceptional 83.6% |
| Croatians | 99.0 /100 | #47 | Exceptional 83.6% |
| Immigrants | Poland | 99.0 /100 | #48 | Exceptional 83.6% |
| Immigrants | Morocco | 99.0 /100 | #49 | Exceptional 83.6% |
| Immigrants | Greece | 98.8 /100 | #50 | Exceptional 83.6% |
| Immigrants | Turkey | 98.8 /100 | #51 | Exceptional 83.6% |