Immigrants from Egypt vs Cape Verdean In Labor Force | Age > 16
COMPARE
Immigrants from Egypt
Cape Verdean
In Labor Force | Age > 16
In Labor Force | Age > 16 Comparison
Immigrants from Egypt
Cape Verdeans
66.2%
IN LABOR FORCE | AGE > 16
99.7/ 100
METRIC RATING
68th/ 347
METRIC RANK
66.6%
IN LABOR FORCE | AGE > 16
100.0/ 100
METRIC RATING
50th/ 347
METRIC RANK
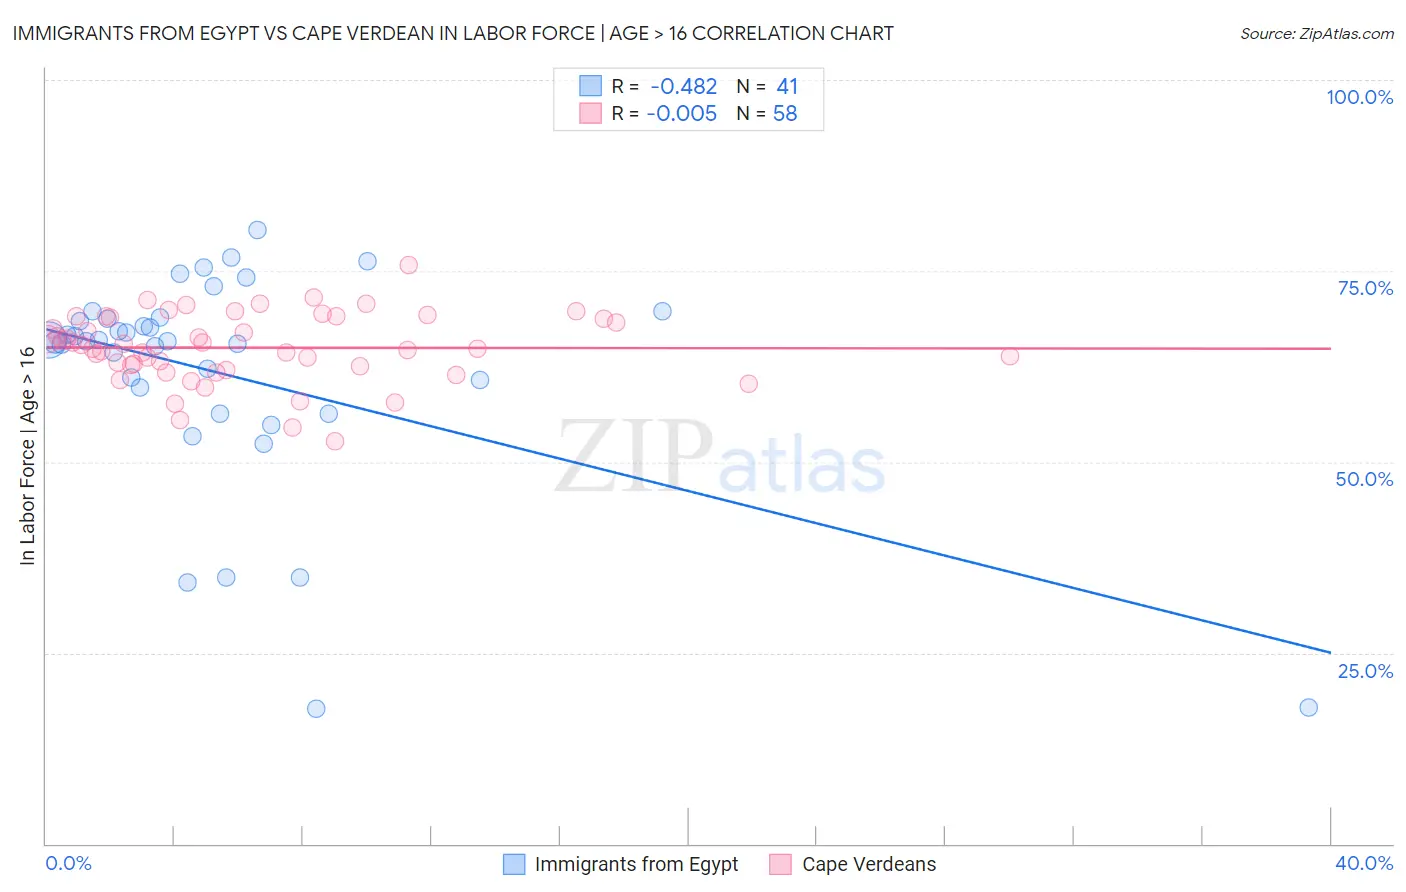
Immigrants from Egypt vs Cape Verdean In Labor Force | Age > 16 Correlation Chart
The statistical analysis conducted on geographies consisting of 245,493,461 people shows a moderate negative correlation between the proportion of Immigrants from Egypt and labor force participation rate among population ages 16 and over in the United States with a correlation coefficient (R) of -0.482 and weighted average of 66.2%. Similarly, the statistical analysis conducted on geographies consisting of 107,578,429 people shows no correlation between the proportion of Cape Verdeans and labor force participation rate among population ages 16 and over in the United States with a correlation coefficient (R) of -0.005 and weighted average of 66.6%, a difference of 0.54%.
In Labor Force | Age > 16 Correlation Summary
| Measurement | Immigrants from Egypt | Cape Verdean |
| Minimum | 17.6% | 52.7% |
| Maximum | 80.4% | 75.8% |
| Range | 62.8% | 23.1% |
| Mean | 61.6% | 64.9% |
| Median | 65.8% | 65.0% |
| Interquartile 25% (IQ1) | 58.0% | 62.6% |
| Interquartile 75% (IQ3) | 68.8% | 68.9% |
| Interquartile Range (IQR) | 10.8% | 6.3% |
| Standard Deviation (Sample) | 14.4% | 4.6% |
| Standard Deviation (Population) | 14.3% | 4.5% |
Demographics Similar to Immigrants from Egypt and Cape Verdeans by In Labor Force | Age > 16
In terms of in labor force | age > 16, the demographic groups most similar to Immigrants from Egypt are Subsaharan African (66.2%, a difference of 0.0%), Egyptian (66.2%, a difference of 0.050%), Jordanian (66.3%, a difference of 0.070%), Sri Lankan (66.3%, a difference of 0.090%), and Venezuelan (66.3%, a difference of 0.11%). Similarly, the demographic groups most similar to Cape Verdeans are Immigrants from Northern Africa (66.6%, a difference of 0.050%), Immigrants from Kuwait (66.5%, a difference of 0.070%), Paraguayan (66.5%, a difference of 0.10%), Immigrants from Sri Lanka (66.5%, a difference of 0.12%), and Immigrants from Bosnia and Herzegovina (66.5%, a difference of 0.15%).
| Demographics | Rating | Rank | In Labor Force | Age > 16 |
| Immigrants | Northern Africa | 100.0 /100 | #49 | Exceptional 66.6% |
| Cape Verdeans | 100.0 /100 | #50 | Exceptional 66.6% |
| Immigrants | Kuwait | 100.0 /100 | #51 | Exceptional 66.5% |
| Paraguayans | 99.9 /100 | #52 | Exceptional 66.5% |
| Immigrants | Sri Lanka | 99.9 /100 | #53 | Exceptional 66.5% |
| Immigrants | Bosnia and Herzegovina | 99.9 /100 | #54 | Exceptional 66.5% |
| Immigrants | Venezuela | 99.9 /100 | #55 | Exceptional 66.4% |
| Immigrants | Senegal | 99.9 /100 | #56 | Exceptional 66.4% |
| Bulgarians | 99.9 /100 | #57 | Exceptional 66.4% |
| Immigrants | Saudi Arabia | 99.9 /100 | #58 | Exceptional 66.3% |
| Immigrants | Turkey | 99.9 /100 | #59 | Exceptional 66.3% |
| Immigrants | Peru | 99.8 /100 | #60 | Exceptional 66.3% |
| Immigrants | Burma/Myanmar | 99.8 /100 | #61 | Exceptional 66.3% |
| Indonesians | 99.8 /100 | #62 | Exceptional 66.3% |
| Venezuelans | 99.8 /100 | #63 | Exceptional 66.3% |
| Peruvians | 99.8 /100 | #64 | Exceptional 66.3% |
| Sri Lankans | 99.8 /100 | #65 | Exceptional 66.3% |
| Jordanians | 99.8 /100 | #66 | Exceptional 66.3% |
| Egyptians | 99.8 /100 | #67 | Exceptional 66.2% |
| Immigrants | Egypt | 99.7 /100 | #68 | Exceptional 66.2% |
| Sub-Saharan Africans | 99.7 /100 | #69 | Exceptional 66.2% |