Immigrants from Ecuador vs Bahamian In Labor Force | Age 45-54
COMPARE
Immigrants from Ecuador
Bahamian
In Labor Force | Age 45-54
In Labor Force | Age 45-54 Comparison
Immigrants from Ecuador
Bahamians
82.2%
IN LABOR FORCE | AGE 45-54
3.4/ 100
METRIC RATING
222nd/ 347
METRIC RANK
82.2%
IN LABOR FORCE | AGE 45-54
3.6/ 100
METRIC RATING
220th/ 347
METRIC RANK
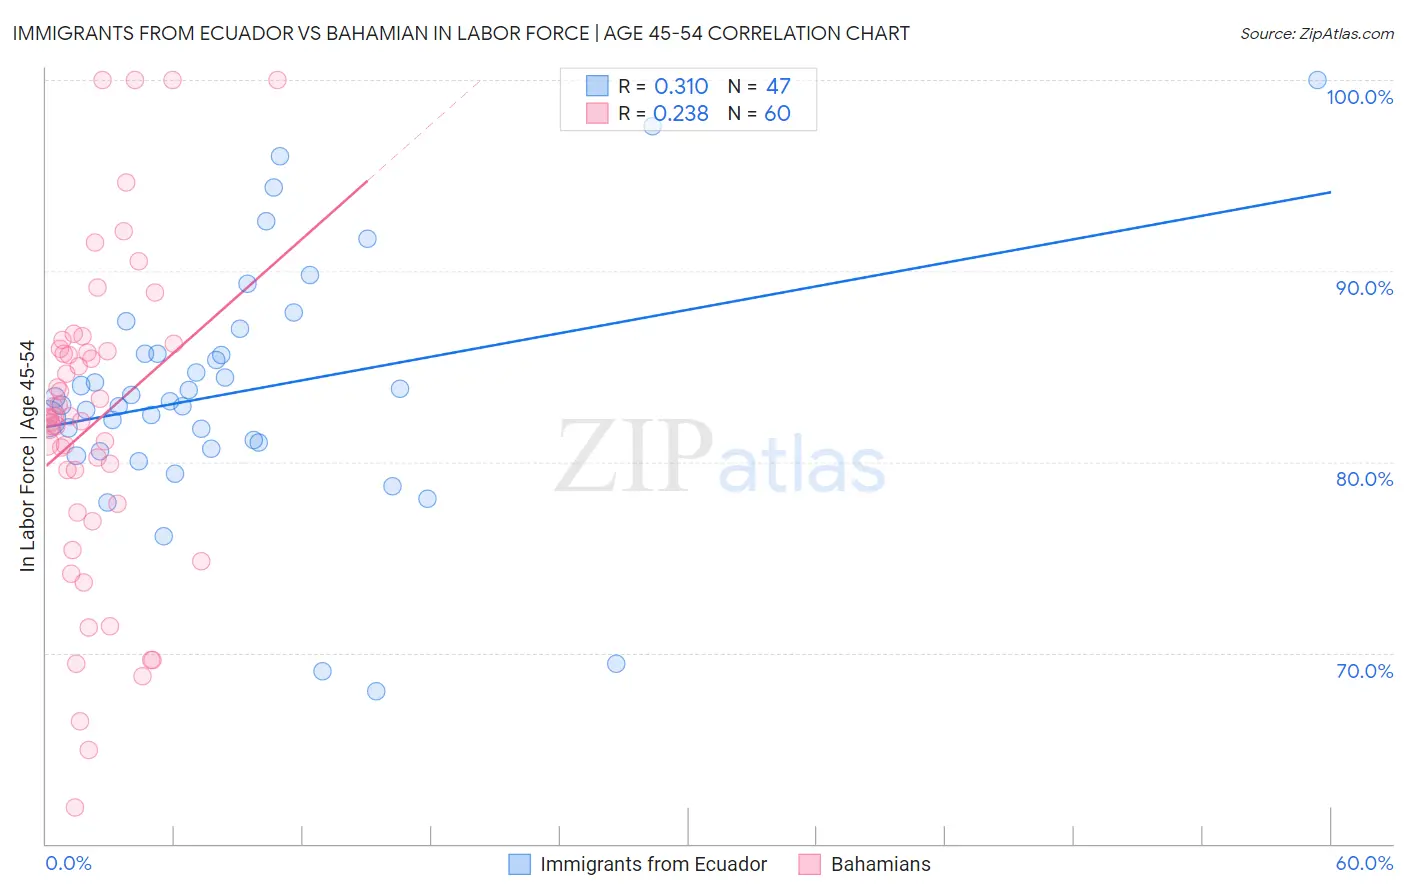
Immigrants from Ecuador vs Bahamian In Labor Force | Age 45-54 Correlation Chart
The statistical analysis conducted on geographies consisting of 270,878,287 people shows a mild positive correlation between the proportion of Immigrants from Ecuador and labor force participation rate among population between the ages 45 and 54 in the United States with a correlation coefficient (R) of 0.310 and weighted average of 82.2%. Similarly, the statistical analysis conducted on geographies consisting of 112,617,260 people shows a weak positive correlation between the proportion of Bahamians and labor force participation rate among population between the ages 45 and 54 in the United States with a correlation coefficient (R) of 0.238 and weighted average of 82.2%, a difference of 0.010%.
In Labor Force | Age 45-54 Correlation Summary
| Measurement | Immigrants from Ecuador | Bahamian |
| Minimum | 68.0% | 61.9% |
| Maximum | 100.0% | 100.0% |
| Range | 32.0% | 38.1% |
| Mean | 83.7% | 82.0% |
| Median | 83.2% | 82.3% |
| Interquartile 25% (IQ1) | 80.7% | 77.6% |
| Interquartile 75% (IQ3) | 85.7% | 85.9% |
| Interquartile Range (IQR) | 5.0% | 8.3% |
| Standard Deviation (Sample) | 6.4% | 8.4% |
| Standard Deviation (Population) | 6.4% | 8.3% |
Demographics Similar to Immigrants from Ecuador and Bahamians by In Labor Force | Age 45-54
In terms of in labor force | age 45-54, the demographic groups most similar to Immigrants from Ecuador are Panamanian (82.2%, a difference of 0.0%), Immigrants (82.1%, a difference of 0.020%), French (82.2%, a difference of 0.040%), English (82.2%, a difference of 0.060%), and Immigrants from Jamaica (82.1%, a difference of 0.060%). Similarly, the demographic groups most similar to Bahamians are Panamanian (82.2%, a difference of 0.010%), French (82.2%, a difference of 0.030%), Immigrants (82.1%, a difference of 0.030%), English (82.2%, a difference of 0.050%), and Portuguese (82.2%, a difference of 0.060%).
| Demographics | Rating | Rank | In Labor Force | Age 45-54 |
| Immigrants | Syria | 6.6 /100 | #211 | Tragic 82.3% |
| Ecuadorians | 6.3 /100 | #212 | Tragic 82.3% |
| Immigrants | Uzbekistan | 5.8 /100 | #213 | Tragic 82.3% |
| Immigrants | Panama | 5.6 /100 | #214 | Tragic 82.2% |
| Iraqis | 5.6 /100 | #215 | Tragic 82.2% |
| Scottish | 5.3 /100 | #216 | Tragic 82.2% |
| Portuguese | 4.7 /100 | #217 | Tragic 82.2% |
| English | 4.4 /100 | #218 | Tragic 82.2% |
| French | 4.1 /100 | #219 | Tragic 82.2% |
| Bahamians | 3.6 /100 | #220 | Tragic 82.2% |
| Panamanians | 3.5 /100 | #221 | Tragic 82.2% |
| Immigrants | Ecuador | 3.4 /100 | #222 | Tragic 82.2% |
| Immigrants | Immigrants | 3.1 /100 | #223 | Tragic 82.1% |
| Immigrants | Jamaica | 2.7 /100 | #224 | Tragic 82.1% |
| Immigrants | Oceania | 2.5 /100 | #225 | Tragic 82.1% |
| Immigrants | Caribbean | 2.5 /100 | #226 | Tragic 82.1% |
| Immigrants | Germany | 2.4 /100 | #227 | Tragic 82.1% |
| Cape Verdeans | 2.1 /100 | #228 | Tragic 82.1% |
| Immigrants | Burma/Myanmar | 1.9 /100 | #229 | Tragic 82.0% |
| Jamaicans | 1.8 /100 | #230 | Tragic 82.0% |
| Immigrants | Senegal | 1.7 /100 | #231 | Tragic 82.0% |