Immigrants from Eastern Europe vs Immigrants from Poland In Labor Force | Age 20-64
COMPARE
Immigrants from Eastern Europe
Immigrants from Poland
In Labor Force | Age 20-64
In Labor Force | Age 20-64 Comparison
Immigrants from Eastern Europe
Immigrants from Poland
80.2%
IN LABOR FORCE | AGE 20-64
98.1/ 100
METRIC RATING
74th/ 347
METRIC RANK
80.6%
IN LABOR FORCE | AGE 20-64
99.9/ 100
METRIC RATING
35th/ 347
METRIC RANK
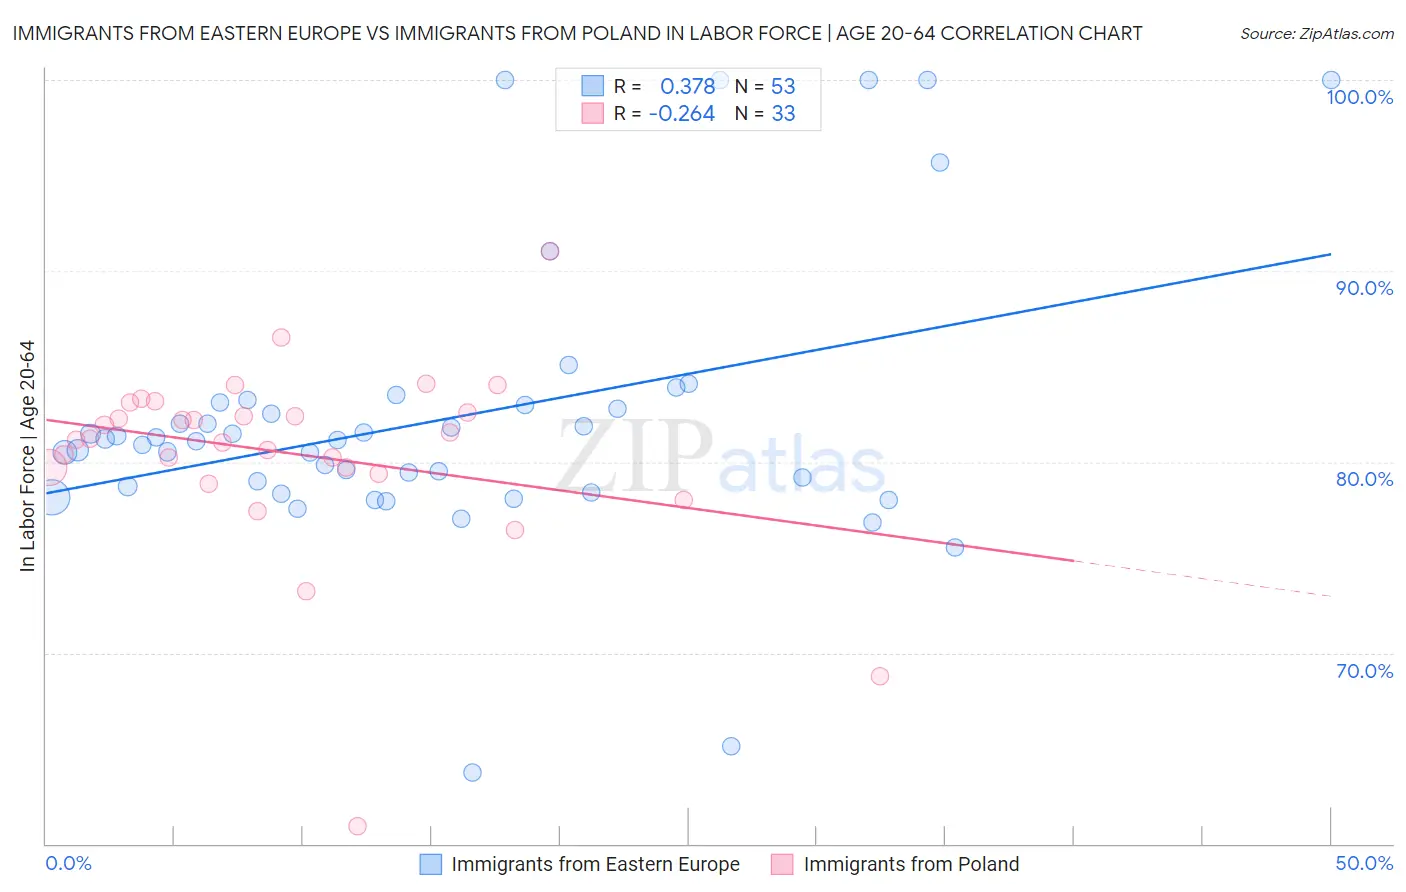
Immigrants from Eastern Europe vs Immigrants from Poland In Labor Force | Age 20-64 Correlation Chart
The statistical analysis conducted on geographies consisting of 475,884,691 people shows a mild positive correlation between the proportion of Immigrants from Eastern Europe and labor force participation rate among population between the ages 20 and 64 in the United States with a correlation coefficient (R) of 0.378 and weighted average of 80.2%. Similarly, the statistical analysis conducted on geographies consisting of 304,860,886 people shows a weak negative correlation between the proportion of Immigrants from Poland and labor force participation rate among population between the ages 20 and 64 in the United States with a correlation coefficient (R) of -0.264 and weighted average of 80.6%, a difference of 0.55%.
In Labor Force | Age 20-64 Correlation Summary
| Measurement | Immigrants from Eastern Europe | Immigrants from Poland |
| Minimum | 63.7% | 60.9% |
| Maximum | 100.0% | 91.0% |
| Range | 36.3% | 30.1% |
| Mean | 82.2% | 80.4% |
| Median | 81.1% | 81.2% |
| Interquartile 25% (IQ1) | 78.6% | 79.5% |
| Interquartile 75% (IQ3) | 83.1% | 82.9% |
| Interquartile Range (IQR) | 4.5% | 3.3% |
| Standard Deviation (Sample) | 7.4% | 5.1% |
| Standard Deviation (Population) | 7.3% | 5.1% |
Similar Demographics by In Labor Force | Age 20-64
Demographics Similar to Immigrants from Eastern Europe by In Labor Force | Age 20-64
In terms of in labor force | age 20-64, the demographic groups most similar to Immigrants from Eastern Europe are Cypriot (80.2%, a difference of 0.010%), Immigrants from Afghanistan (80.2%, a difference of 0.010%), Egyptian (80.2%, a difference of 0.030%), Immigrants from Colombia (80.2%, a difference of 0.030%), and Immigrants from Romania (80.2%, a difference of 0.030%).
| Demographics | Rating | Rank | In Labor Force | Age 20-64 |
| Taiwanese | 98.6 /100 | #67 | Exceptional 80.2% |
| Bhutanese | 98.6 /100 | #68 | Exceptional 80.2% |
| Albanians | 98.6 /100 | #69 | Exceptional 80.2% |
| Immigrants | Turkey | 98.5 /100 | #70 | Exceptional 80.2% |
| Soviet Union | 98.5 /100 | #71 | Exceptional 80.2% |
| Eastern Europeans | 98.4 /100 | #72 | Exceptional 80.2% |
| Cypriots | 98.2 /100 | #73 | Exceptional 80.2% |
| Immigrants | Eastern Europe | 98.1 /100 | #74 | Exceptional 80.2% |
| Immigrants | Afghanistan | 97.9 /100 | #75 | Exceptional 80.2% |
| Egyptians | 97.8 /100 | #76 | Exceptional 80.2% |
| Immigrants | Colombia | 97.8 /100 | #77 | Exceptional 80.2% |
| Immigrants | Romania | 97.8 /100 | #78 | Exceptional 80.2% |
| Asians | 97.7 /100 | #79 | Exceptional 80.2% |
| Immigrants | Croatia | 97.6 /100 | #80 | Exceptional 80.1% |
| German Russians | 97.3 /100 | #81 | Exceptional 80.1% |
Demographics Similar to Immigrants from Poland by In Labor Force | Age 20-64
In terms of in labor force | age 20-64, the demographic groups most similar to Immigrants from Poland are Immigrants from Brazil (80.7%, a difference of 0.030%), Chinese (80.7%, a difference of 0.050%), Paraguayan (80.6%, a difference of 0.070%), Immigrants from Moldova (80.6%, a difference of 0.070%), and Immigrants from Ireland (80.7%, a difference of 0.090%).
| Demographics | Rating | Rank | In Labor Force | Age 20-64 |
| Immigrants | Uganda | 99.9 /100 | #28 | Exceptional 80.7% |
| Immigrants | South Central Asia | 99.9 /100 | #29 | Exceptional 80.7% |
| Immigrants | North Macedonia | 99.9 /100 | #30 | Exceptional 80.7% |
| Immigrants | Lithuania | 99.9 /100 | #31 | Exceptional 80.7% |
| Immigrants | Ireland | 99.9 /100 | #32 | Exceptional 80.7% |
| Chinese | 99.9 /100 | #33 | Exceptional 80.7% |
| Immigrants | Brazil | 99.9 /100 | #34 | Exceptional 80.7% |
| Immigrants | Poland | 99.9 /100 | #35 | Exceptional 80.6% |
| Paraguayans | 99.8 /100 | #36 | Exceptional 80.6% |
| Immigrants | Moldova | 99.8 /100 | #37 | Exceptional 80.6% |
| Ugandans | 99.8 /100 | #38 | Exceptional 80.6% |
| Brazilians | 99.8 /100 | #39 | Exceptional 80.5% |
| Immigrants | Zimbabwe | 99.8 /100 | #40 | Exceptional 80.5% |
| Immigrants | Liberia | 99.8 /100 | #41 | Exceptional 80.5% |
| Latvians | 99.8 /100 | #42 | Exceptional 80.5% |