Immigrants from Eastern Asia vs Immigrants from Ethiopia In Labor Force | Age > 16

COMPARE

Immigrants from Eastern Asia
Race
Ancestry
AfghanAfricanAlaska NativeAlaskan AthabascanAlbanianAleutAlsatianAmericanApacheArabArapahoArgentineanArmenianAssyrian/Chaldean/SyriacAustralianAustrianBahamianBangladeshiBarbadianBasqueBelgianBelizeanBermudanBhutaneseBlackfeetBolivianBrazilianBritishBritish West IndianBulgarianBurmeseCajunCambodianCanadianCape VerdeanCarpatho RusynCelticCentral AmericanCentral American IndianCherokeeCheyenneChickasawChileanChineseChippewaChoctawColombianColvilleComancheCosta RicanCreeCreekCroatianCrowCubanCypriotCzechCzechoslovakianDanishDelawareDominicanDutchDutch West IndianEastern EuropeanEcuadorianEgyptianEnglishEstonianEthiopianEuropeanFijianFilipinoFinnishFrenchFrench American IndianFrench CanadianGermanGerman RussianGhanaianGreekGuamanian/ChamorroGuatemalanGuyaneseHaitianHmongHonduranHopiHoumaHungarianIcelanderIndian (Asian)IndonesianInupiatIranianIraqiIrishIroquoisIsraeliItalianJamaicanJapaneseJordanianKenyanKiowaKoreanLaotianLatvianLebaneseLiberianLithuanianLumbeeLuxembourgerMacedonianMalaysianMalteseMarshalleseMenomineeMexicanMexican American IndianMongolianMoroccanNative HawaiianNavajoNepaleseNew ZealanderNicaraguanNigerianNorthern EuropeanNorwegianOkinawanOsageOttawaPaiutePakistaniPalestinianPanamanianParaguayanPennsylvania GermanPeruvianPimaPolishPortuguesePotawatomiPuebloPuerto RicanPuget Sound SalishRomanianRussianSalvadoranSamoanScandinavianScotch-IrishScottishSeminoleSenegaleseSerbianShoshoneSierra LeoneanSiouxSlavicSlovakSloveneSomaliSouth AfricanSouth AmericanSouth American IndianSoviet UnionSpaniardSpanishSpanish AmericanSpanish American IndianSri LankanSubsaharan AfricanSudaneseSwedishSwissSyrianTaiwaneseThaiTlingit-HaidaTohono O'OdhamTonganTrinidadian and TobagonianTsimshianTurkishU.S. Virgin IslanderUgandanUkrainianUruguayanUteVenezuelanVietnameseWelshWest IndianYakamaYaquiYugoslavianYumanYup'ikZimbabwean
Immigration
NonimmigrantsImmigrantsAfghanistanAfricaAlbaniaArgentinaArmeniaAsiaAustraliaAustriaBahamasBangladeshBarbadosBelarusBelgiumBelizeBoliviaBosnia and HerzegovinaBrazilBulgariaBurma/MyanmarCabo VerdeCambodiaCameroonCanadaCaribbeanCentral AmericaChileChinaColombiaCongoCosta RicaCroatiaCubaCzechoslovakiaDenmarkDominicaDominican RepublicEastern AfricaEastern AsiaEastern EuropeEcuadorEgyptEl SalvadorEnglandEritreaEuropeFijiFranceGermanyGhanaGreeceGrenadaGuatemalaGuyanaHaitiHondurasHong KongHungaryIndiaIndonesiaIranIraqIrelandIsraelItalyJamaicaJapanJordanKazakhstanKenyaKoreaKuwaitLaosLatin AmericaLatviaLebanonLiberiaLithuaniaMalaysiaMexicoMicronesiaMiddle AfricaMoldovaMoroccoNepalNetherlandsNicaraguaNigeriaNorth AmericaNorth MacedoniaNorthern AfricaNorthern EuropeNorwayOceaniaPakistanPanamaPeruPhilippinesPolandPortugalRomaniaRussiaSaudi ArabiaScotlandSenegalSerbiaSierra LeoneSingaporeSomaliaSouth AfricaSouth AmericaSouth Central AsiaSouth Eastern AsiaSouthern EuropeSpainSri LankaSt. Vincent and the GrenadinesSudanSwedenSwitzerlandSyriaTaiwanThailandTrinidad and TobagoTurkeyUgandaUkraineUruguayUzbekistanVenezuelaVietnamWest IndiesWestern AfricaWestern AsiaWestern EuropeYemenZaireZimbabweAzores
Immigrants from Ethiopia
Race
Ancestry
AfghanAfricanAlaska NativeAlaskan AthabascanAlbanianAleutAlsatianAmericanApacheArabArapahoArgentineanArmenianAssyrian/Chaldean/SyriacAustralianAustrianBahamianBangladeshiBarbadianBasqueBelgianBelizeanBermudanBhutaneseBlackfeetBolivianBrazilianBritishBritish West IndianBulgarianBurmeseCajunCambodianCanadianCape VerdeanCarpatho RusynCelticCentral AmericanCentral American IndianCherokeeCheyenneChickasawChileanChineseChippewaChoctawColombianColvilleComancheCosta RicanCreeCreekCroatianCrowCubanCypriotCzechCzechoslovakianDanishDelawareDominicanDutchDutch West IndianEastern EuropeanEcuadorianEgyptianEnglishEstonianEthiopianEuropeanFijianFilipinoFinnishFrenchFrench American IndianFrench CanadianGermanGerman RussianGhanaianGreekGuamanian/ChamorroGuatemalanGuyaneseHaitianHmongHonduranHopiHoumaHungarianIcelanderIndian (Asian)IndonesianInupiatIranianIraqiIrishIroquoisIsraeliItalianJamaicanJapaneseJordanianKenyanKiowaKoreanLaotianLatvianLebaneseLiberianLithuanianLumbeeLuxembourgerMacedonianMalaysianMalteseMarshalleseMenomineeMexicanMexican American IndianMongolianMoroccanNative HawaiianNavajoNepaleseNew ZealanderNicaraguanNigerianNorthern EuropeanNorwegianOkinawanOsageOttawaPaiutePakistaniPalestinianPanamanianParaguayanPennsylvania GermanPeruvianPimaPolishPortuguesePotawatomiPuebloPuerto RicanPuget Sound SalishRomanianRussianSalvadoranSamoanScandinavianScotch-IrishScottishSeminoleSenegaleseSerbianShoshoneSierra LeoneanSiouxSlavicSlovakSloveneSomaliSouth AfricanSouth AmericanSouth American IndianSoviet UnionSpaniardSpanishSpanish AmericanSpanish American IndianSri LankanSubsaharan AfricanSudaneseSwedishSwissSyrianTaiwaneseThaiTlingit-HaidaTohono O'OdhamTonganTrinidadian and TobagonianTsimshianTurkishU.S. Virgin IslanderUgandanUkrainianUruguayanUteVenezuelanVietnameseWelshWest IndianYakamaYaquiYugoslavianYumanYup'ikZimbabwean
Immigration
NonimmigrantsImmigrantsAfghanistanAfricaAlbaniaArgentinaArmeniaAsiaAustraliaAustriaBahamasBangladeshBarbadosBelarusBelgiumBelizeBoliviaBosnia and HerzegovinaBrazilBulgariaBurma/MyanmarCabo VerdeCambodiaCameroonCanadaCaribbeanCentral AmericaChileChinaColombiaCongoCosta RicaCroatiaCubaCzechoslovakiaDenmarkDominicaDominican RepublicEastern AfricaEastern EuropeEcuadorEgyptEl SalvadorEnglandEritreaEthiopiaEuropeFijiFranceGermanyGhanaGreeceGrenadaGuatemalaGuyanaHaitiHondurasHong KongHungaryIndiaIndonesiaIranIraqIrelandIsraelItalyJamaicaJapanJordanKazakhstanKenyaKoreaKuwaitLaosLatin AmericaLatviaLebanonLiberiaLithuaniaMalaysiaMexicoMicronesiaMiddle AfricaMoldovaMoroccoNepalNetherlandsNicaraguaNigeriaNorth AmericaNorth MacedoniaNorthern AfricaNorthern EuropeNorwayOceaniaPakistanPanamaPeruPhilippinesPolandPortugalRomaniaRussiaSaudi ArabiaScotlandSenegalSerbiaSierra LeoneSingaporeSomaliaSouth AfricaSouth AmericaSouth Central AsiaSouth Eastern AsiaSouthern EuropeSpainSri LankaSt. Vincent and the GrenadinesSudanSwedenSwitzerlandSyriaTaiwanThailandTrinidad and TobagoTurkeyUgandaUkraineUruguayUzbekistanVenezuelaVietnamWest IndiesWestern AfricaWestern AsiaWestern EuropeYemenZaireZimbabweAzores
In Labor Force | Age > 16
Income
Poverty
Unemployment
Labor Participation
Family Structure
Vehicle Availability
Education Level
Disability

In Labor Force | Age > 16 Comparison

Immigrants from Eastern Asia

Immigrants from Ethiopia

Exceptional
Exceptional
65.7%
IN LABOR FORCE | AGE > 16
94.9/ 100
METRIC RATING
127th/ 347
METRIC RANK
69.4%
IN LABOR FORCE | AGE > 16
100.0/ 100
METRIC RATING
1st/ 347
METRIC RANK

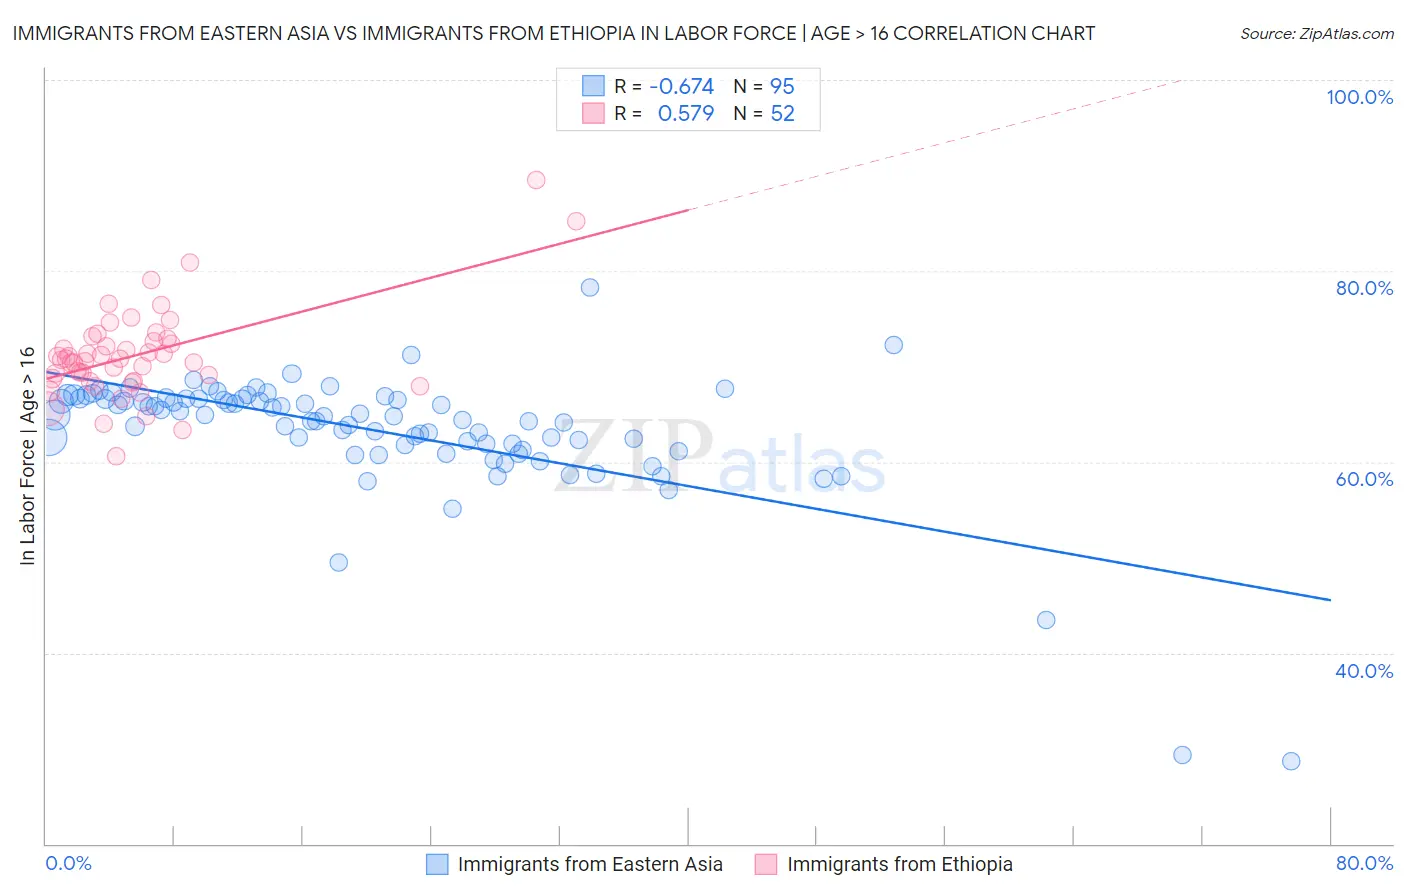
Immigrants from Eastern Asia vs Immigrants from Ethiopia In Labor Force | Age > 16 Correlation Chart

The statistical analysis conducted on geographies consisting of 499,974,052 people shows a significant negative correlation between the proportion of Immigrants from Eastern Asia and labor force participation rate among population ages 16 and over in the United States with a correlation coefficient (R) of -0.674 and weighted average of 65.7%. Similarly, the statistical analysis conducted on geographies consisting of 211,573,899 people shows a substantial positive correlation between the proportion of Immigrants from Ethiopia and labor force participation rate among population ages 16 and over in the United States with a correlation coefficient (R) of 0.579 and weighted average of 69.4%, a difference of 5.7%.
Immigrants from Eastern Asia vs Immigrants from Ethiopia In Labor Force | Age > 16

In Labor Force | Age > 16 Correlation Summary

MeasurementImmigrants from Eastern AsiaImmigrants from Ethiopia
Minimum28.6%60.6%
Maximum78.3%89.5%
Range49.7%28.9%
Mean63.3%71.2%
Median64.8%70.8%
Interquartile 25% (IQ1)61.7%68.6%
Interquartile 75% (IQ3)66.6%72.8%
Interquartile Range (IQR)4.9%4.2%
Standard Deviation (Sample)6.7%4.9%
Standard Deviation (Population)6.7%4.9%

Similar Demographics by In Labor Force | Age > 16

Demographics Similar to Immigrants from Eastern Asia by In Labor Force | Age > 16

In terms of in labor force | age > 16, the demographic groups most similar to Immigrants from Eastern Asia are Ecuadorian (65.6%, a difference of 0.010%), Korean (65.7%, a difference of 0.020%), Immigrants from Philippines (65.6%, a difference of 0.020%), Iraqi (65.7%, a difference of 0.030%), and Norwegian (65.7%, a difference of 0.030%).
DemographicsRating | RankIn Labor Force | Age > 16
Immigrants | Hong Kong
96.2
/100
|
#120
Exceptional
65.7%
New Zealanders
96.0
/100
|
#121
Exceptional
65.7%
Immigrants | Ecuador
95.9
/100
|
#122
Exceptional
65.7%
Immigrants | Iraq
95.5
/100
|
#123
Exceptional
65.7%
Iraqis
95.4
/100
|
#124
Exceptional
65.7%
Norwegians
95.3
/100
|
#125
Exceptional
65.7%
Koreans
95.3
/100
|
#126
Exceptional
65.7%
Immigrants | Eastern Asia
94.9
/100
|
#127
Exceptional
65.7%
Ecuadorians
94.7
/100
|
#128
Exceptional
65.6%
Immigrants | Philippines
94.5
/100
|
#129
Exceptional
65.6%
Immigrants | Guatemala
94.4
/100
|
#130
Exceptional
65.6%
Icelanders
94.3
/100
|
#131
Exceptional
65.6%
Immigrants | North Macedonia
94.1
/100
|
#132
Exceptional
65.6%
Immigrants | Lithuania
93.5
/100
|
#133
Exceptional
65.6%
Costa Ricans
93.2
/100
|
#134
Exceptional
65.6%

Demographics Similar to Immigrants from Ethiopia by In Labor Force | Age > 16

In terms of in labor force | age > 16, the demographic groups most similar to Immigrants from Ethiopia are Ethiopian (69.3%, a difference of 0.16%), Somali (69.2%, a difference of 0.36%), Immigrants from Somalia (69.1%, a difference of 0.44%), Sierra Leonean (68.9%, a difference of 0.75%), and Immigrants from Eritrea (68.9%, a difference of 0.80%).
DemographicsRating | RankIn Labor Force | Age > 16
Immigrants | Ethiopia
100.0
/100
|
#1
Exceptional
69.4%
Ethiopians
100.0
/100
|
#2
Exceptional
69.3%
Somalis
100.0
/100
|
#3
Exceptional
69.2%
Immigrants | Somalia
100.0
/100
|
#4
Exceptional
69.1%
Sierra Leoneans
100.0
/100
|
#5
Exceptional
68.9%
Immigrants | Eritrea
100.0
/100
|
#6
Exceptional
68.9%
Immigrants | Cameroon
100.0
/100
|
#7
Exceptional
68.7%
Immigrants | Sierra Leone
100.0
/100
|
#8
Exceptional
68.5%
Immigrants | Eastern Africa
100.0
/100
|
#9
Exceptional
68.5%
Immigrants | Bolivia
100.0
/100
|
#10
Exceptional
68.4%
Bolivians
100.0
/100
|
#11
Exceptional
68.2%
Sudanese
100.0
/100
|
#12
Exceptional
68.0%
Immigrants | Nepal
100.0
/100
|
#13
Exceptional
68.0%
Liberians
100.0
/100
|
#14
Exceptional
67.8%
Immigrants | Middle Africa
100.0
/100
|
#15
Exceptional
67.7%