Immigrants from Eastern Africa vs Nepalese In Labor Force | Age > 16
COMPARE
Immigrants from Eastern Africa
Nepalese
In Labor Force | Age > 16
In Labor Force | Age > 16 Comparison
Immigrants from Eastern Africa
Nepalese
68.5%
IN LABOR FORCE | AGE > 16
100.0/ 100
METRIC RATING
9th/ 347
METRIC RANK
63.8%
IN LABOR FORCE | AGE > 16
0.1/ 100
METRIC RATING
291st/ 347
METRIC RANK
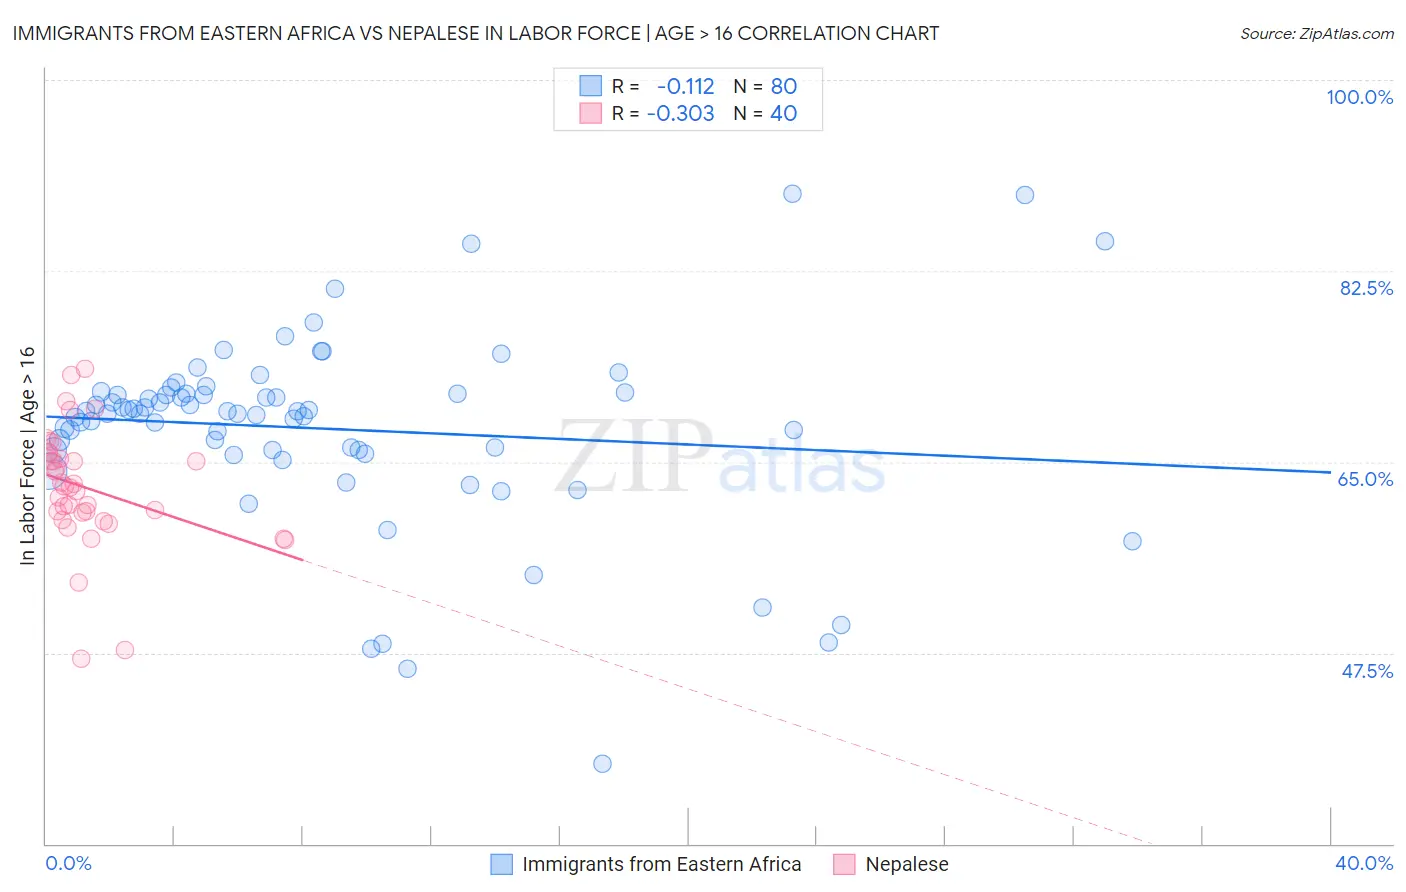
Immigrants from Eastern Africa vs Nepalese In Labor Force | Age > 16 Correlation Chart
The statistical analysis conducted on geographies consisting of 355,171,869 people shows a poor negative correlation between the proportion of Immigrants from Eastern Africa and labor force participation rate among population ages 16 and over in the United States with a correlation coefficient (R) of -0.112 and weighted average of 68.5%. Similarly, the statistical analysis conducted on geographies consisting of 24,521,755 people shows a mild negative correlation between the proportion of Nepalese and labor force participation rate among population ages 16 and over in the United States with a correlation coefficient (R) of -0.303 and weighted average of 63.8%, a difference of 7.3%.
In Labor Force | Age > 16 Correlation Summary
| Measurement | Immigrants from Eastern Africa | Nepalese |
| Minimum | 37.3% | 47.0% |
| Maximum | 89.6% | 73.5% |
| Range | 52.3% | 26.5% |
| Mean | 68.0% | 62.6% |
| Median | 69.5% | 62.7% |
| Interquartile 25% (IQ1) | 66.0% | 60.0% |
| Interquartile 75% (IQ3) | 71.3% | 65.6% |
| Interquartile Range (IQR) | 5.2% | 5.5% |
| Standard Deviation (Sample) | 8.8% | 5.5% |
| Standard Deviation (Population) | 8.7% | 5.4% |
Similar Demographics by In Labor Force | Age > 16
Demographics Similar to Immigrants from Eastern Africa by In Labor Force | Age > 16
In terms of in labor force | age > 16, the demographic groups most similar to Immigrants from Eastern Africa are Immigrants from Sierra Leone (68.5%, a difference of 0.010%), Immigrants from Bolivia (68.4%, a difference of 0.030%), Immigrants from Cameroon (68.7%, a difference of 0.33%), Bolivian (68.2%, a difference of 0.40%), and Immigrants from Eritrea (68.9%, a difference of 0.58%).
| Demographics | Rating | Rank | In Labor Force | Age > 16 |
| Ethiopians | 100.0 /100 | #2 | Exceptional 69.3% |
| Somalis | 100.0 /100 | #3 | Exceptional 69.2% |
| Immigrants | Somalia | 100.0 /100 | #4 | Exceptional 69.1% |
| Sierra Leoneans | 100.0 /100 | #5 | Exceptional 68.9% |
| Immigrants | Eritrea | 100.0 /100 | #6 | Exceptional 68.9% |
| Immigrants | Cameroon | 100.0 /100 | #7 | Exceptional 68.7% |
| Immigrants | Sierra Leone | 100.0 /100 | #8 | Exceptional 68.5% |
| Immigrants | Eastern Africa | 100.0 /100 | #9 | Exceptional 68.5% |
| Immigrants | Bolivia | 100.0 /100 | #10 | Exceptional 68.4% |
| Bolivians | 100.0 /100 | #11 | Exceptional 68.2% |
| Sudanese | 100.0 /100 | #12 | Exceptional 68.0% |
| Immigrants | Nepal | 100.0 /100 | #13 | Exceptional 68.0% |
| Liberians | 100.0 /100 | #14 | Exceptional 67.8% |
| Immigrants | Middle Africa | 100.0 /100 | #15 | Exceptional 67.7% |
| Immigrants | Sudan | 100.0 /100 | #16 | Exceptional 67.7% |
Demographics Similar to Nepalese by In Labor Force | Age > 16
In terms of in labor force | age > 16, the demographic groups most similar to Nepalese are Hungarian (63.8%, a difference of 0.010%), Celtic (63.8%, a difference of 0.040%), Spanish American Indian (63.8%, a difference of 0.060%), Spanish (63.9%, a difference of 0.070%), and English (63.7%, a difference of 0.10%).
| Demographics | Rating | Rank | In Labor Force | Age > 16 |
| French | 0.1 /100 | #284 | Tragic 63.9% |
| Slovaks | 0.1 /100 | #285 | Tragic 63.9% |
| Immigrants | Austria | 0.1 /100 | #286 | Tragic 63.9% |
| Scottish | 0.1 /100 | #287 | Tragic 63.9% |
| Spanish | 0.1 /100 | #288 | Tragic 63.9% |
| Celtics | 0.1 /100 | #289 | Tragic 63.8% |
| Hungarians | 0.1 /100 | #290 | Tragic 63.8% |
| Nepalese | 0.1 /100 | #291 | Tragic 63.8% |
| Spanish American Indians | 0.1 /100 | #292 | Tragic 63.8% |
| English | 0.1 /100 | #293 | Tragic 63.7% |
| Puget Sound Salish | 0.0 /100 | #294 | Tragic 63.7% |
| Immigrants | Canada | 0.0 /100 | #295 | Tragic 63.7% |
| Immigrants | North America | 0.0 /100 | #296 | Tragic 63.7% |
| Immigrants | Grenada | 0.0 /100 | #297 | Tragic 63.6% |
| Comanche | 0.0 /100 | #298 | Tragic 63.6% |