Immigrants from Czechoslovakia vs Dutch In Labor Force | Age 20-24

COMPARE

Immigrants from Czechoslovakia
Race
Ancestry
AfghanAfricanAlaska NativeAlaskan AthabascanAlbanianAleutAlsatianAmericanApacheArabArapahoArgentineanArmenianAssyrian/Chaldean/SyriacAustralianAustrianBahamianBangladeshiBarbadianBasqueBelgianBelizeanBermudanBhutaneseBlackfeetBolivianBrazilianBritishBritish West IndianBulgarianBurmeseCajunCambodianCanadianCape VerdeanCarpatho RusynCelticCentral AmericanCentral American IndianCherokeeCheyenneChickasawChileanChineseChippewaChoctawColombianColvilleComancheCosta RicanCreeCreekCroatianCrowCubanCypriotCzechCzechoslovakianDanishDelawareDominicanDutch West IndianEastern EuropeanEcuadorianEgyptianEnglishEstonianEthiopianEuropeanFijianFilipinoFinnishFrenchFrench American IndianFrench CanadianGermanGerman RussianGhanaianGreekGuamanian/ChamorroGuatemalanGuyaneseHaitianHmongHonduranHopiHoumaHungarianIcelanderIndian (Asian)IndonesianInupiatIranianIraqiIrishIroquoisIsraeliItalianJamaicanJapaneseJordanianKenyanKiowaKoreanLaotianLatvianLebaneseLiberianLithuanianLumbeeLuxembourgerMacedonianMalaysianMalteseMarshalleseMenomineeMexicanMexican American IndianMongolianMoroccanNative HawaiianNavajoNepaleseNew ZealanderNicaraguanNigerianNorthern EuropeanNorwegianOkinawanOsageOttawaPaiutePakistaniPalestinianPanamanianParaguayanPennsylvania GermanPeruvianPimaPolishPortuguesePotawatomiPuebloPuerto RicanPuget Sound SalishRomanianRussianSalvadoranSamoanScandinavianScotch-IrishScottishSeminoleSenegaleseSerbianShoshoneSierra LeoneanSiouxSlavicSlovakSloveneSomaliSouth AfricanSouth AmericanSouth American IndianSoviet UnionSpaniardSpanishSpanish AmericanSpanish American IndianSri LankanSubsaharan AfricanSudaneseSwedishSwissSyrianTaiwaneseThaiTlingit-HaidaTohono O'OdhamTonganTrinidadian and TobagonianTsimshianTurkishU.S. Virgin IslanderUgandanUkrainianUruguayanUteVenezuelanVietnameseWelshWest IndianYakamaYaquiYugoslavianYumanYup'ikZimbabwean
Immigration
NonimmigrantsImmigrantsAfghanistanAfricaAlbaniaArgentinaArmeniaAsiaAustraliaAustriaBahamasBangladeshBarbadosBelarusBelgiumBelizeBoliviaBosnia and HerzegovinaBrazilBulgariaBurma/MyanmarCabo VerdeCambodiaCameroonCanadaCaribbeanCentral AmericaChileChinaColombiaCongoCosta RicaCroatiaCubaCzechoslovakiaDenmarkDominicaDominican RepublicEastern AfricaEastern AsiaEastern EuropeEcuadorEgyptEl SalvadorEnglandEritreaEthiopiaEuropeFijiFranceGermanyGhanaGreeceGrenadaGuatemalaGuyanaHaitiHondurasHong KongHungaryIndiaIndonesiaIranIraqIrelandIsraelItalyJamaicaJapanJordanKazakhstanKenyaKoreaKuwaitLaosLatin AmericaLatviaLebanonLiberiaLithuaniaMalaysiaMexicoMicronesiaMiddle AfricaMoldovaMoroccoNepalNetherlandsNicaraguaNigeriaNorth AmericaNorth MacedoniaNorthern AfricaNorthern EuropeNorwayOceaniaPakistanPanamaPeruPhilippinesPolandPortugalRomaniaRussiaSaudi ArabiaScotlandSenegalSerbiaSierra LeoneSingaporeSomaliaSouth AfricaSouth AmericaSouth Central AsiaSouth Eastern AsiaSouthern EuropeSpainSri LankaSt. Vincent and the GrenadinesSudanSwedenSwitzerlandSyriaTaiwanThailandTrinidad and TobagoTurkeyUgandaUkraineUruguayUzbekistanVenezuelaVietnamWest IndiesWestern AfricaWestern AsiaWestern EuropeYemenZaireZimbabweAzores
Dutch
Race
Ancestry
AfghanAfricanAlaska NativeAlaskan AthabascanAlbanianAleutAlsatianAmericanApacheArabArapahoArgentineanArmenianAssyrian/Chaldean/SyriacAustralianAustrianBahamianBangladeshiBarbadianBasqueBelgianBelizeanBermudanBhutaneseBlackfeetBolivianBrazilianBritishBritish West IndianBulgarianBurmeseCajunCambodianCanadianCape VerdeanCarpatho RusynCelticCentral AmericanCentral American IndianCherokeeCheyenneChickasawChileanChineseChippewaChoctawColombianColvilleComancheCosta RicanCreeCreekCroatianCrowCubanCypriotCzechCzechoslovakianDanishDelawareDominicanDutchDutch West IndianEastern EuropeanEcuadorianEgyptianEnglishEstonianEthiopianEuropeanFijianFilipinoFinnishFrenchFrench American IndianFrench CanadianGermanGerman RussianGhanaianGreekGuamanian/ChamorroGuatemalanGuyaneseHaitianHmongHonduranHopiHoumaHungarianIcelanderIndian (Asian)IndonesianInupiatIranianIraqiIrishIroquoisIsraeliItalianJamaicanJapaneseJordanianKenyanKiowaKoreanLaotianLatvianLebaneseLiberianLithuanianLumbeeLuxembourgerMacedonianMalaysianMalteseMarshalleseMenomineeMexicanMexican American IndianMongolianMoroccanNative HawaiianNavajoNepaleseNew ZealanderNicaraguanNigerianNorthern EuropeanNorwegianOkinawanOsageOttawaPaiutePakistaniPalestinianPanamanianParaguayanPennsylvania GermanPeruvianPimaPolishPortuguesePotawatomiPuebloPuerto RicanPuget Sound SalishRomanianRussianSalvadoranSamoanScandinavianScotch-IrishScottishSeminoleSenegaleseSerbianShoshoneSierra LeoneanSiouxSlavicSlovakSloveneSomaliSouth AfricanSouth AmericanSouth American IndianSoviet UnionSpaniardSpanishSpanish AmericanSpanish American IndianSri LankanSubsaharan AfricanSudaneseSwedishSwissSyrianTaiwaneseThaiTlingit-HaidaTohono O'OdhamTonganTrinidadian and TobagonianTsimshianTurkishU.S. Virgin IslanderUgandanUkrainianUruguayanUteVenezuelanVietnameseWelshWest IndianYakamaYaquiYugoslavianYumanYup'ikZimbabwean
Immigration
NonimmigrantsImmigrantsAfghanistanAfricaAlbaniaArgentinaArmeniaAsiaAustraliaAustriaBahamasBangladeshBarbadosBelarusBelgiumBelizeBoliviaBosnia and HerzegovinaBrazilBulgariaBurma/MyanmarCabo VerdeCambodiaCameroonCanadaCaribbeanCentral AmericaChileChinaColombiaCongoCosta RicaCroatiaCubaDenmarkDominicaDominican RepublicEastern AfricaEastern AsiaEastern EuropeEcuadorEgyptEl SalvadorEnglandEritreaEthiopiaEuropeFijiFranceGermanyGhanaGreeceGrenadaGuatemalaGuyanaHaitiHondurasHong KongHungaryIndiaIndonesiaIranIraqIrelandIsraelItalyJamaicaJapanJordanKazakhstanKenyaKoreaKuwaitLaosLatin AmericaLatviaLebanonLiberiaLithuaniaMalaysiaMexicoMicronesiaMiddle AfricaMoldovaMoroccoNepalNetherlandsNicaraguaNigeriaNorth AmericaNorth MacedoniaNorthern AfricaNorthern EuropeNorwayOceaniaPakistanPanamaPeruPhilippinesPolandPortugalRomaniaRussiaSaudi ArabiaScotlandSenegalSerbiaSierra LeoneSingaporeSomaliaSouth AfricaSouth AmericaSouth Central AsiaSouth Eastern AsiaSouthern EuropeSpainSri LankaSt. Vincent and the GrenadinesSudanSwedenSwitzerlandSyriaTaiwanThailandTrinidad and TobagoTurkeyUgandaUkraineUruguayUzbekistanVenezuelaVietnamWest IndiesWestern AfricaWestern AsiaWestern EuropeYemenZaireZimbabweAzores
In Labor Force | Age 20-24
Income
Poverty
Unemployment
Labor Participation
Family Structure
Vehicle Availability
Education Level
Disability

In Labor Force | Age 20-24 Comparison

Immigrants from Czechoslovakia

Dutch

Average
Exceptional
75.0%
IN LABOR FORCE | AGE 20-24
44.0/ 100
METRIC RATING
180th/ 347
METRIC RANK
78.4%
IN LABOR FORCE | AGE 20-24
100.0/ 100
METRIC RATING
16th/ 347
METRIC RANK

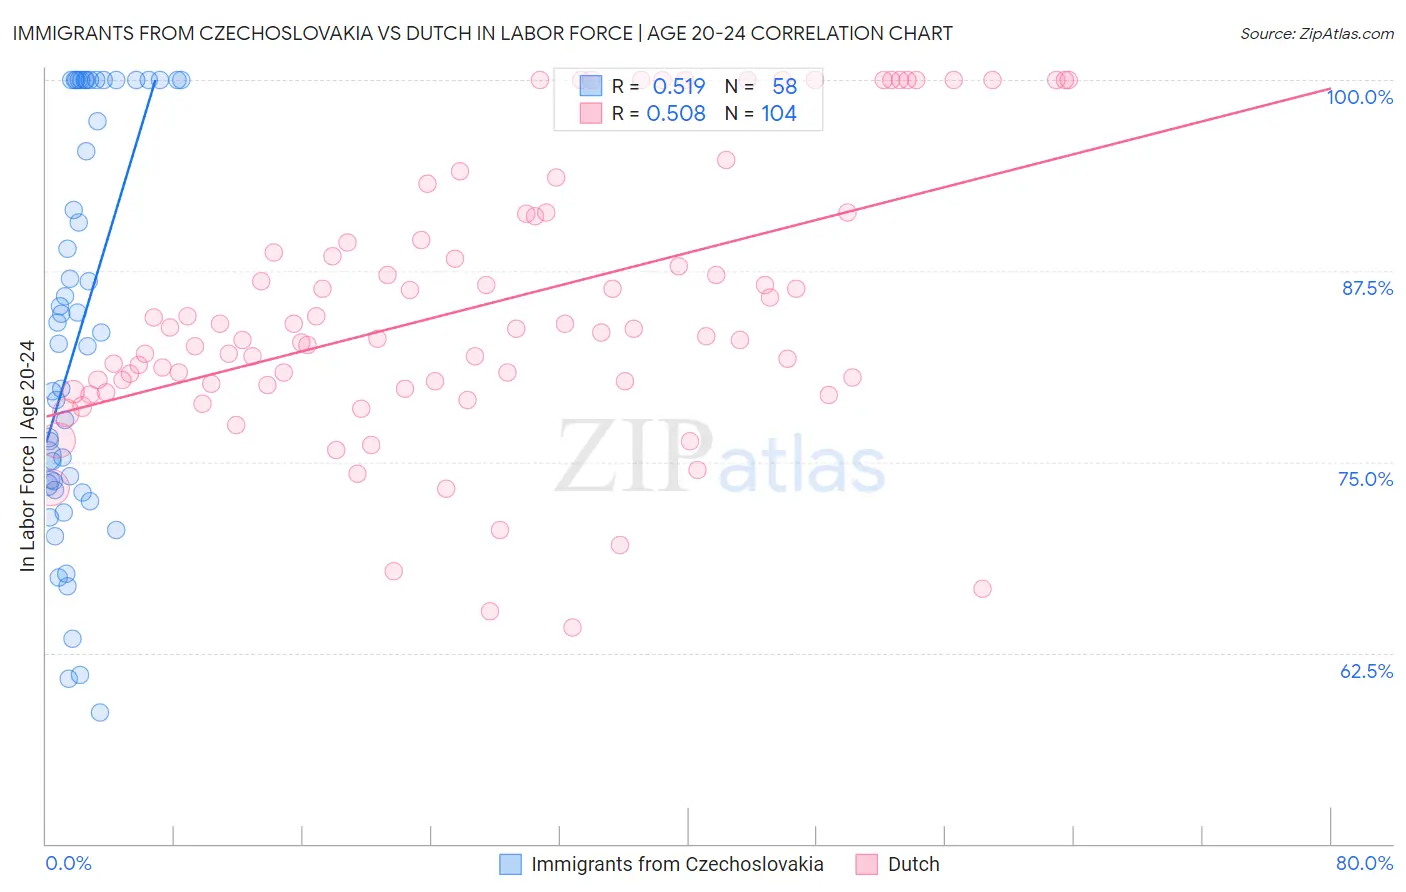
Immigrants from Czechoslovakia vs Dutch In Labor Force | Age 20-24 Correlation Chart

The statistical analysis conducted on geographies consisting of 195,383,549 people shows a substantial positive correlation between the proportion of Immigrants from Czechoslovakia and labor force participation rate among population between the ages 20 and 24 in the United States with a correlation coefficient (R) of 0.519 and weighted average of 75.0%. Similarly, the statistical analysis conducted on geographies consisting of 553,167,013 people shows a substantial positive correlation between the proportion of Dutch and labor force participation rate among population between the ages 20 and 24 in the United States with a correlation coefficient (R) of 0.508 and weighted average of 78.4%, a difference of 4.5%.
Immigrants from Czechoslovakia vs Dutch In Labor Force | Age 20-24

In Labor Force | Age 20-24 Correlation Summary

MeasurementImmigrants from CzechoslovakiaDutch
Minimum58.6%64.1%
Maximum100.0%100.0%
Range41.4%35.9%
Mean83.6%85.3%
Median83.1%83.6%
Interquartile 25% (IQ1)73.5%80.1%
Interquartile 75% (IQ3)100.0%91.2%
Interquartile Range (IQR)26.5%11.1%
Standard Deviation (Sample)12.9%9.0%
Standard Deviation (Population)12.8%9.0%

Similar Demographics by In Labor Force | Age 20-24

Demographics Similar to Immigrants from Czechoslovakia by In Labor Force | Age 20-24

In terms of in labor force | age 20-24, the demographic groups most similar to Immigrants from Czechoslovakia are Immigrants from Latvia (75.0%, a difference of 0.0%), Immigrants from Central America (75.0%, a difference of 0.010%), African (75.0%, a difference of 0.020%), Immigrants from Mexico (75.0%, a difference of 0.060%), and Central American (75.0%, a difference of 0.070%).
DemographicsRating | RankIn Labor Force | Age 20-24
Immigrants | Croatia
50.2
/100
|
#173
Average
75.1%
South Africans
50.0
/100
|
#174
Average
75.0%
Syrians
49.5
/100
|
#175
Average
75.0%
Central Americans
48.7
/100
|
#176
Average
75.0%
Immigrants | Mexico
47.8
/100
|
#177
Average
75.0%
Immigrants | Central America
45.0
/100
|
#178
Average
75.0%
Immigrants | Latvia
44.1
/100
|
#179
Average
75.0%
Immigrants | Czechoslovakia
44.0
/100
|
#180
Average
75.0%
Africans
42.5
/100
|
#181
Average
75.0%
Immigrants | South Africa
36.9
/100
|
#182
Fair
74.9%
Immigrants | Costa Rica
36.7
/100
|
#183
Fair
74.9%
Immigrants | Hungary
35.0
/100
|
#184
Fair
74.9%
Sri Lankans
34.9
/100
|
#185
Fair
74.9%
Immigrants | Eastern Europe
33.8
/100
|
#186
Fair
74.9%
Immigrants | Honduras
33.5
/100
|
#187
Fair
74.9%

Demographics Similar to Dutch by In Labor Force | Age 20-24

In terms of in labor force | age 20-24, the demographic groups most similar to Dutch are Cape Verdean (78.3%, a difference of 0.040%), Sudanese (78.4%, a difference of 0.050%), Czech (78.5%, a difference of 0.18%), Scandinavian (78.5%, a difference of 0.19%), and German (78.6%, a difference of 0.26%).
DemographicsRating | RankIn Labor Force | Age 20-24
Swedes
100.0
/100
|
#9
Exceptional
78.8%
Slovenes
100.0
/100
|
#10
Exceptional
78.7%
Finns
100.0
/100
|
#11
Exceptional
78.7%
Germans
100.0
/100
|
#12
Exceptional
78.6%
Scandinavians
100.0
/100
|
#13
Exceptional
78.5%
Czechs
100.0
/100
|
#14
Exceptional
78.5%
Sudanese
100.0
/100
|
#15
Exceptional
78.4%
Dutch
100.0
/100
|
#16
Exceptional
78.4%
Cape Verdeans
100.0
/100
|
#17
Exceptional
78.3%
Immigrants | Bosnia and Herzegovina
100.0
/100
|
#18
Exceptional
78.1%
Bangladeshis
100.0
/100
|
#19
Exceptional
78.1%
French Canadians
100.0
/100
|
#20
Exceptional
78.1%
Puget Sound Salish
100.0
/100
|
#21
Exceptional
78.0%
Pennsylvania Germans
100.0
/100
|
#22
Exceptional
78.0%
Yugoslavians
100.0
/100
|
#23
Exceptional
78.0%