Immigrants from Costa Rica vs Immigrants from Oceania In Labor Force | Age > 16
COMPARE
Immigrants from Costa Rica
Immigrants from Oceania
In Labor Force | Age > 16
In Labor Force | Age > 16 Comparison
Immigrants from Costa Rica
Immigrants from Oceania
65.5%
IN LABOR FORCE | AGE > 16
90.8/ 100
METRIC RATING
140th/ 347
METRIC RANK
65.5%
IN LABOR FORCE | AGE > 16
87.5/ 100
METRIC RATING
147th/ 347
METRIC RANK
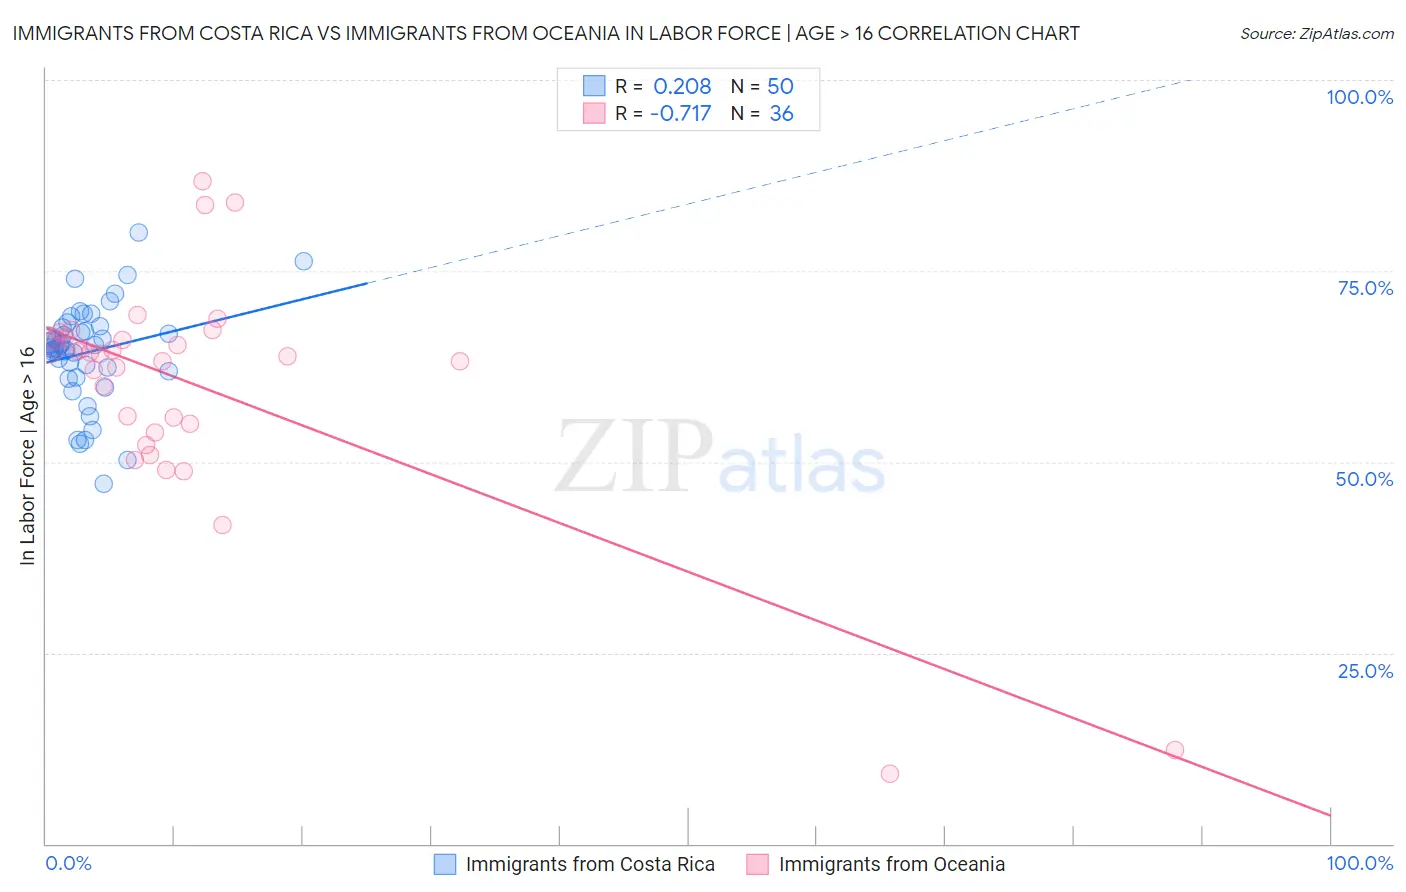
Immigrants from Costa Rica vs Immigrants from Oceania In Labor Force | Age > 16 Correlation Chart
The statistical analysis conducted on geographies consisting of 204,275,671 people shows a weak positive correlation between the proportion of Immigrants from Costa Rica and labor force participation rate among population ages 16 and over in the United States with a correlation coefficient (R) of 0.208 and weighted average of 65.5%. Similarly, the statistical analysis conducted on geographies consisting of 305,520,725 people shows a strong negative correlation between the proportion of Immigrants from Oceania and labor force participation rate among population ages 16 and over in the United States with a correlation coefficient (R) of -0.717 and weighted average of 65.5%, a difference of 0.090%.
In Labor Force | Age > 16 Correlation Summary
| Measurement | Immigrants from Costa Rica | Immigrants from Oceania |
| Minimum | 47.1% | 9.1% |
| Maximum | 80.1% | 86.8% |
| Range | 33.0% | 77.7% |
| Mean | 64.3% | 59.8% |
| Median | 65.1% | 63.9% |
| Interquartile 25% (IQ1) | 61.9% | 54.4% |
| Interquartile 75% (IQ3) | 67.7% | 66.1% |
| Interquartile Range (IQR) | 5.8% | 11.7% |
| Standard Deviation (Sample) | 6.5% | 15.4% |
| Standard Deviation (Population) | 6.5% | 15.2% |
Demographics Similar to Immigrants from Costa Rica and Immigrants from Oceania by In Labor Force | Age > 16
In terms of in labor force | age > 16, the demographic groups most similar to Immigrants from Costa Rica are Immigrants from Taiwan (65.5%, a difference of 0.0%), Samoan (65.5%, a difference of 0.010%), Indian (Asian) (65.5%, a difference of 0.040%), Latvian (65.5%, a difference of 0.040%), and Immigrants from West Indies (65.6%, a difference of 0.050%). Similarly, the demographic groups most similar to Immigrants from Oceania are Tlingit-Haida (65.5%, a difference of 0.020%), Cypriot (65.5%, a difference of 0.020%), Immigrants from Romania (65.5%, a difference of 0.030%), Bhutanese (65.5%, a difference of 0.030%), and Immigrants from Albania (65.4%, a difference of 0.040%).
| Demographics | Rating | Rank | In Labor Force | Age > 16 |
| Immigrants | Lithuania | 93.5 /100 | #133 | Exceptional 65.6% |
| Costa Ricans | 93.2 /100 | #134 | Exceptional 65.6% |
| Guatemalans | 92.5 /100 | #135 | Exceptional 65.6% |
| Immigrants | Argentina | 92.4 /100 | #136 | Exceptional 65.6% |
| Guamanians/Chamorros | 92.4 /100 | #137 | Exceptional 65.6% |
| Immigrants | West Indies | 92.0 /100 | #138 | Exceptional 65.6% |
| Immigrants | Taiwan | 90.8 /100 | #139 | Exceptional 65.5% |
| Immigrants | Costa Rica | 90.8 /100 | #140 | Exceptional 65.5% |
| Samoans | 90.5 /100 | #141 | Exceptional 65.5% |
| Indians (Asian) | 89.5 /100 | #142 | Excellent 65.5% |
| Latvians | 89.4 /100 | #143 | Excellent 65.5% |
| Immigrants | Romania | 88.6 /100 | #144 | Excellent 65.5% |
| Tlingit-Haida | 88.3 /100 | #145 | Excellent 65.5% |
| Cypriots | 88.2 /100 | #146 | Excellent 65.5% |
| Immigrants | Oceania | 87.5 /100 | #147 | Excellent 65.5% |
| Bhutanese | 86.3 /100 | #148 | Excellent 65.5% |
| Immigrants | Albania | 85.7 /100 | #149 | Excellent 65.4% |
| Immigrants | Immigrants | 81.9 /100 | #150 | Excellent 65.4% |
| Czechs | 81.5 /100 | #151 | Excellent 65.4% |
| Yugoslavians | 81.3 /100 | #152 | Excellent 65.4% |
| Immigrants | China | 80.5 /100 | #153 | Excellent 65.4% |