Immigrants from China vs Laotian In Labor Force | Age 16-19
COMPARE
Immigrants from China
Laotian
In Labor Force | Age 16-19
In Labor Force | Age 16-19 Comparison
Immigrants from China
Laotians
31.1%
IN LABOR FORCE | AGE 16-19
0.0/ 100
METRIC RATING
325th/ 347
METRIC RANK
34.9%
IN LABOR FORCE | AGE 16-19
2.4/ 100
METRIC RATING
247th/ 347
METRIC RANK
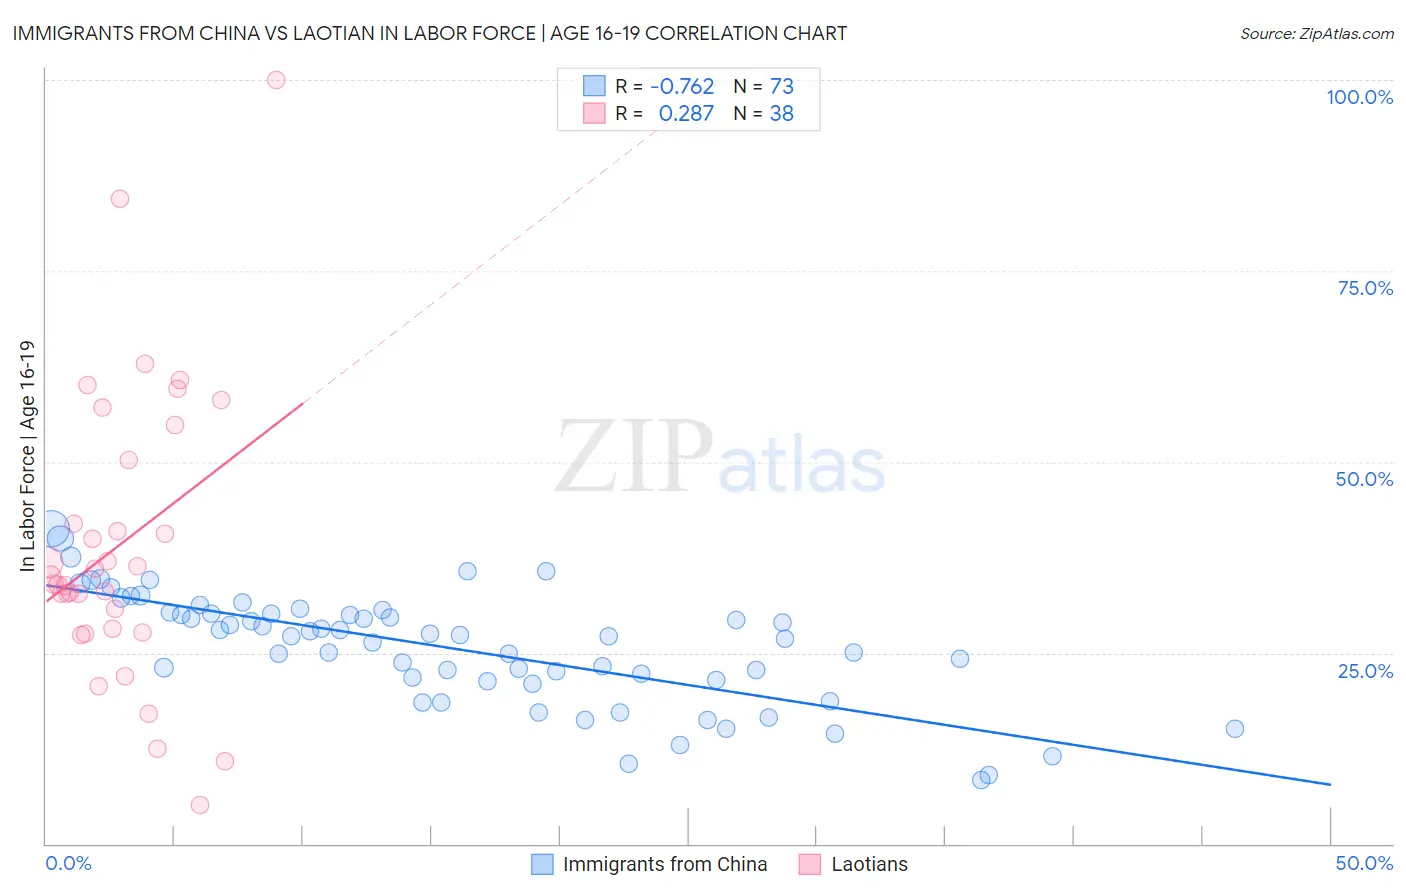
Immigrants from China vs Laotian In Labor Force | Age 16-19 Correlation Chart
The statistical analysis conducted on geographies consisting of 456,166,794 people shows a strong negative correlation between the proportion of Immigrants from China and labor force participation rate among population between the ages 16 and 19 in the United States with a correlation coefficient (R) of -0.762 and weighted average of 31.1%. Similarly, the statistical analysis conducted on geographies consisting of 224,669,771 people shows a weak positive correlation between the proportion of Laotians and labor force participation rate among population between the ages 16 and 19 in the United States with a correlation coefficient (R) of 0.287 and weighted average of 34.9%, a difference of 11.9%.
In Labor Force | Age 16-19 Correlation Summary
| Measurement | Immigrants from China | Laotian |
| Minimum | 8.3% | 5.1% |
| Maximum | 41.3% | 100.0% |
| Range | 33.0% | 94.9% |
| Mean | 25.6% | 39.1% |
| Median | 27.2% | 34.5% |
| Interquartile 25% (IQ1) | 21.3% | 28.1% |
| Interquartile 75% (IQ3) | 30.2% | 50.3% |
| Interquartile Range (IQR) | 8.8% | 22.2% |
| Standard Deviation (Sample) | 7.3% | 19.0% |
| Standard Deviation (Population) | 7.3% | 18.8% |
Similar Demographics by In Labor Force | Age 16-19
Demographics Similar to Immigrants from China by In Labor Force | Age 16-19
In terms of in labor force | age 16-19, the demographic groups most similar to Immigrants from China are Dominican (31.2%, a difference of 0.15%), Immigrants from Dominican Republic (31.1%, a difference of 0.20%), Immigrants from Caribbean (31.2%, a difference of 0.33%), Immigrants from Taiwan (31.0%, a difference of 0.36%), and Immigrants from Ecuador (31.0%, a difference of 0.40%).
| Demographics | Rating | Rank | In Labor Force | Age 16-19 |
| Immigrants | Yemen | 0.0 /100 | #318 | Tragic 31.5% |
| Soviet Union | 0.0 /100 | #319 | Tragic 31.4% |
| Ecuadorians | 0.0 /100 | #320 | Tragic 31.4% |
| West Indians | 0.0 /100 | #321 | Tragic 31.3% |
| Tohono O'odham | 0.0 /100 | #322 | Tragic 31.3% |
| Immigrants | Caribbean | 0.0 /100 | #323 | Tragic 31.2% |
| Dominicans | 0.0 /100 | #324 | Tragic 31.2% |
| Immigrants | China | 0.0 /100 | #325 | Tragic 31.1% |
| Immigrants | Dominican Republic | 0.0 /100 | #326 | Tragic 31.1% |
| Immigrants | Taiwan | 0.0 /100 | #327 | Tragic 31.0% |
| Immigrants | Ecuador | 0.0 /100 | #328 | Tragic 31.0% |
| Barbadians | 0.0 /100 | #329 | Tragic 31.0% |
| Lumbee | 0.0 /100 | #330 | Tragic 31.0% |
| Trinidadians and Tobagonians | 0.0 /100 | #331 | Tragic 30.9% |
| Immigrants | Israel | 0.0 /100 | #332 | Tragic 30.5% |
Demographics Similar to Laotians by In Labor Force | Age 16-19
In terms of in labor force | age 16-19, the demographic groups most similar to Laotians are Immigrants from Sri Lanka (34.9%, a difference of 0.010%), Immigrants from Greece (34.9%, a difference of 0.030%), Immigrants from Turkey (34.9%, a difference of 0.090%), Central American (34.8%, a difference of 0.090%), and Pueblo (34.9%, a difference of 0.11%).
| Demographics | Rating | Rank | In Labor Force | Age 16-19 |
| Immigrants | Central America | 3.0 /100 | #240 | Tragic 35.0% |
| Immigrants | Ireland | 2.9 /100 | #241 | Tragic 35.0% |
| Uruguayans | 2.6 /100 | #242 | Tragic 34.9% |
| Pueblo | 2.6 /100 | #243 | Tragic 34.9% |
| Immigrants | Turkey | 2.6 /100 | #244 | Tragic 34.9% |
| Immigrants | Greece | 2.4 /100 | #245 | Tragic 34.9% |
| Immigrants | Sri Lanka | 2.4 /100 | #246 | Tragic 34.9% |
| Laotians | 2.4 /100 | #247 | Tragic 34.9% |
| Central Americans | 2.2 /100 | #248 | Tragic 34.8% |
| Immigrants | Ukraine | 2.2 /100 | #249 | Tragic 34.8% |
| Immigrants | Pakistan | 2.0 /100 | #250 | Tragic 34.8% |
| Immigrants | Western Asia | 2.0 /100 | #251 | Tragic 34.8% |
| Immigrants | Chile | 2.0 /100 | #252 | Tragic 34.8% |
| Immigrants | Japan | 1.5 /100 | #253 | Tragic 34.7% |
| Bahamians | 1.4 /100 | #254 | Tragic 34.6% |