Immigrants from Chile vs Bermudan In Labor Force | Age 16-19
COMPARE
Immigrants from Chile
Bermudan
In Labor Force | Age 16-19
In Labor Force | Age 16-19 Comparison
Immigrants from Chile
Bermudans
34.8%
IN LABOR FORCE | AGE 16-19
2.0/ 100
METRIC RATING
252nd/ 347
METRIC RANK
36.9%
IN LABOR FORCE | AGE 16-19
69.3/ 100
METRIC RATING
163rd/ 347
METRIC RANK
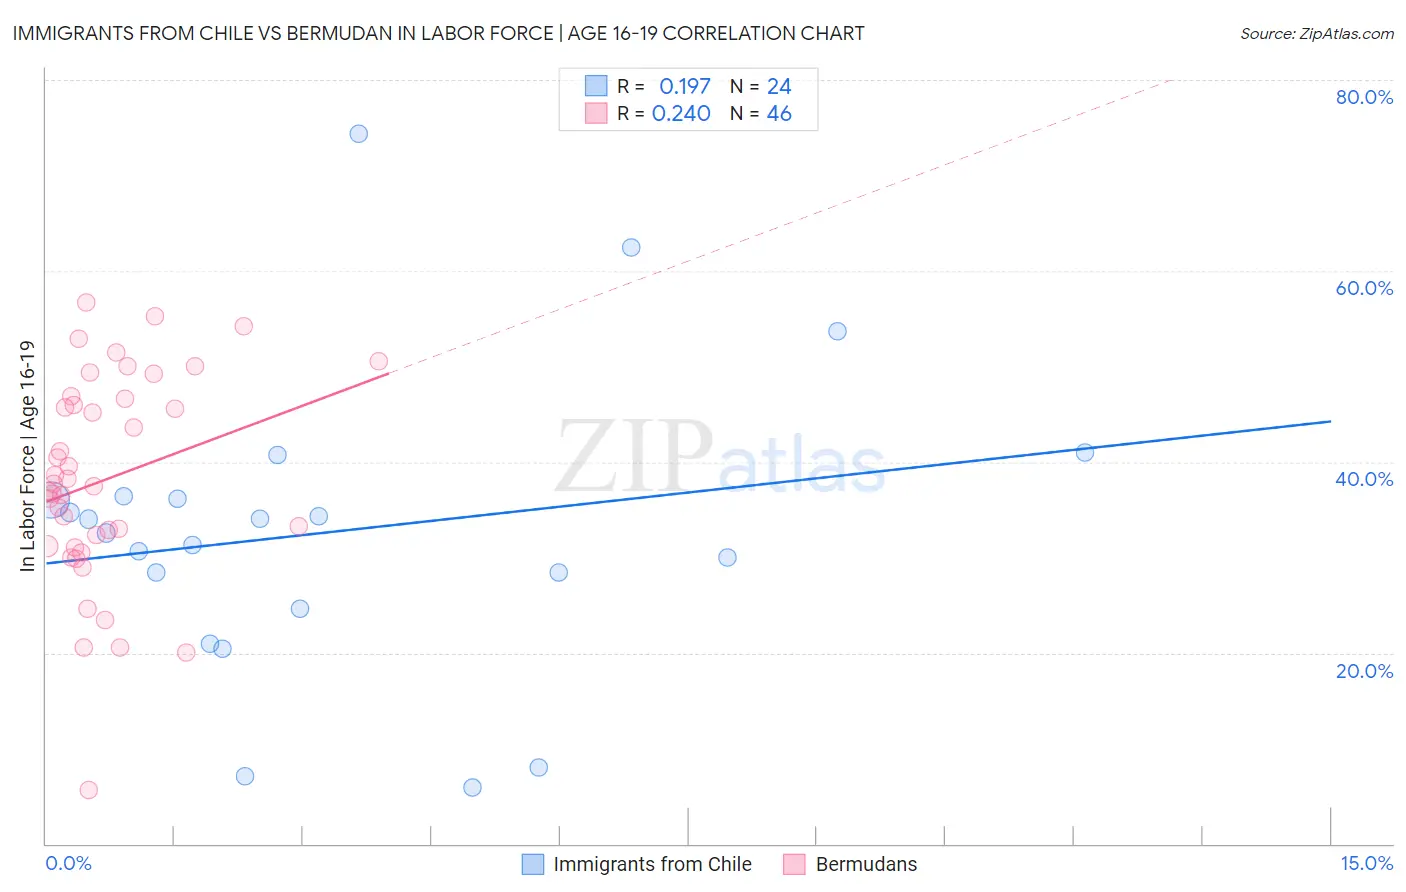
Immigrants from Chile vs Bermudan In Labor Force | Age 16-19 Correlation Chart
The statistical analysis conducted on geographies consisting of 218,497,464 people shows a poor positive correlation between the proportion of Immigrants from Chile and labor force participation rate among population between the ages 16 and 19 in the United States with a correlation coefficient (R) of 0.197 and weighted average of 34.8%. Similarly, the statistical analysis conducted on geographies consisting of 55,701,640 people shows a weak positive correlation between the proportion of Bermudans and labor force participation rate among population between the ages 16 and 19 in the United States with a correlation coefficient (R) of 0.240 and weighted average of 36.9%, a difference of 6.2%.
In Labor Force | Age 16-19 Correlation Summary
| Measurement | Immigrants from Chile | Bermudan |
| Minimum | 5.9% | 5.6% |
| Maximum | 74.4% | 56.7% |
| Range | 68.5% | 51.1% |
| Mean | 32.8% | 38.2% |
| Median | 33.3% | 37.6% |
| Interquartile 25% (IQ1) | 26.5% | 31.2% |
| Interquartile 75% (IQ3) | 36.3% | 46.6% |
| Interquartile Range (IQR) | 9.8% | 15.4% |
| Standard Deviation (Sample) | 15.7% | 10.9% |
| Standard Deviation (Population) | 15.3% | 10.8% |
Similar Demographics by In Labor Force | Age 16-19
Demographics Similar to Immigrants from Chile by In Labor Force | Age 16-19
In terms of in labor force | age 16-19, the demographic groups most similar to Immigrants from Chile are Immigrants from Western Asia (34.8%, a difference of 0.010%), Immigrants from Pakistan (34.8%, a difference of 0.030%), Immigrants from Ukraine (34.8%, a difference of 0.12%), Central American (34.8%, a difference of 0.15%), and Laotian (34.9%, a difference of 0.24%).
| Demographics | Rating | Rank | In Labor Force | Age 16-19 |
| Immigrants | Greece | 2.4 /100 | #245 | Tragic 34.9% |
| Immigrants | Sri Lanka | 2.4 /100 | #246 | Tragic 34.9% |
| Laotians | 2.4 /100 | #247 | Tragic 34.9% |
| Central Americans | 2.2 /100 | #248 | Tragic 34.8% |
| Immigrants | Ukraine | 2.2 /100 | #249 | Tragic 34.8% |
| Immigrants | Pakistan | 2.0 /100 | #250 | Tragic 34.8% |
| Immigrants | Western Asia | 2.0 /100 | #251 | Tragic 34.8% |
| Immigrants | Chile | 2.0 /100 | #252 | Tragic 34.8% |
| Immigrants | Japan | 1.5 /100 | #253 | Tragic 34.7% |
| Bahamians | 1.4 /100 | #254 | Tragic 34.6% |
| Peruvians | 1.4 /100 | #255 | Tragic 34.6% |
| Immigrants | South Central Asia | 1.3 /100 | #256 | Tragic 34.6% |
| Immigrants | Egypt | 1.2 /100 | #257 | Tragic 34.6% |
| Thais | 1.2 /100 | #258 | Tragic 34.6% |
| Immigrants | Immigrants | 1.2 /100 | #259 | Tragic 34.6% |
Demographics Similar to Bermudans by In Labor Force | Age 16-19
In terms of in labor force | age 16-19, the demographic groups most similar to Bermudans are Immigrants from Jordan (36.9%, a difference of 0.010%), Immigrants from Kuwait (36.9%, a difference of 0.020%), Cambodian (37.0%, a difference of 0.13%), Yakama (36.9%, a difference of 0.14%), and Immigrants from Western Africa (36.9%, a difference of 0.15%).
| Demographics | Rating | Rank | In Labor Force | Age 16-19 |
| Kiowa | 80.4 /100 | #156 | Excellent 37.2% |
| Immigrants | Brazil | 76.5 /100 | #157 | Good 37.1% |
| Ute | 75.7 /100 | #158 | Good 37.1% |
| Yaqui | 74.4 /100 | #159 | Good 37.1% |
| Immigrants | Saudi Arabia | 73.9 /100 | #160 | Good 37.0% |
| Cambodians | 71.5 /100 | #161 | Good 37.0% |
| Immigrants | Jordan | 69.5 /100 | #162 | Good 36.9% |
| Bermudans | 69.3 /100 | #163 | Good 36.9% |
| Immigrants | Kuwait | 68.9 /100 | #164 | Good 36.9% |
| Yakama | 66.9 /100 | #165 | Good 36.9% |
| Immigrants | Western Africa | 66.7 /100 | #166 | Good 36.9% |
| Arabs | 63.6 /100 | #167 | Good 36.8% |
| Palestinians | 63.1 /100 | #168 | Good 36.8% |
| Immigrants | Latvia | 61.6 /100 | #169 | Good 36.8% |
| Immigrants | South Africa | 60.5 /100 | #170 | Good 36.8% |