Immigrants from Caribbean vs South American In Labor Force | Age 25-29
COMPARE
Immigrants from Caribbean
South American
In Labor Force | Age 25-29
In Labor Force | Age 25-29 Comparison
Immigrants from Caribbean
South Americans
83.4%
IN LABOR FORCE | AGE 25-29
0.0/ 100
METRIC RATING
272nd/ 347
METRIC RANK
84.7%
IN LABOR FORCE | AGE 25-29
54.9/ 100
METRIC RATING
168th/ 347
METRIC RANK
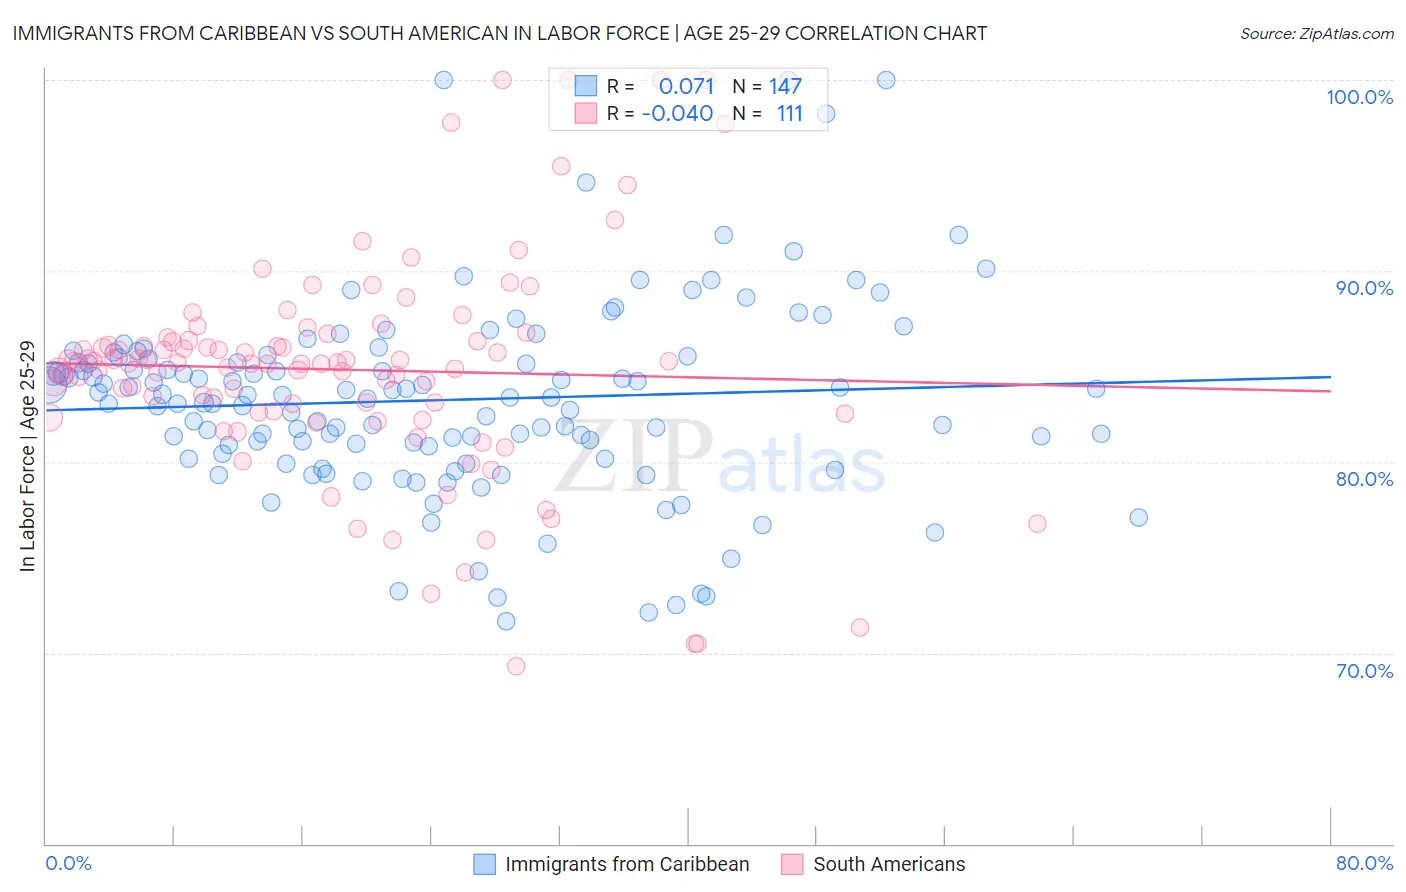
Immigrants from Caribbean vs South American In Labor Force | Age 25-29 Correlation Chart
The statistical analysis conducted on geographies consisting of 449,813,481 people shows a slight positive correlation between the proportion of Immigrants from Caribbean and labor force participation rate among population between the ages 25 and 29 in the United States with a correlation coefficient (R) of 0.071 and weighted average of 83.4%. Similarly, the statistical analysis conducted on geographies consisting of 493,840,082 people shows no correlation between the proportion of South Americans and labor force participation rate among population between the ages 25 and 29 in the United States with a correlation coefficient (R) of -0.040 and weighted average of 84.7%, a difference of 1.6%.
In Labor Force | Age 25-29 Correlation Summary
| Measurement | Immigrants from Caribbean | South American |
| Minimum | 71.7% | 69.3% |
| Maximum | 100.0% | 100.0% |
| Range | 28.3% | 30.7% |
| Mean | 83.2% | 84.8% |
| Median | 83.4% | 85.2% |
| Interquartile 25% (IQ1) | 80.8% | 82.6% |
| Interquartile 75% (IQ3) | 85.5% | 86.4% |
| Interquartile Range (IQR) | 4.7% | 3.7% |
| Standard Deviation (Sample) | 5.0% | 5.7% |
| Standard Deviation (Population) | 5.0% | 5.7% |
Similar Demographics by In Labor Force | Age 25-29
Demographics Similar to Immigrants from Caribbean by In Labor Force | Age 25-29
In terms of in labor force | age 25-29, the demographic groups most similar to Immigrants from Caribbean are Immigrants from Dominica (83.4%, a difference of 0.0%), Honduran (83.4%, a difference of 0.030%), Marshallese (83.3%, a difference of 0.030%), Basque (83.4%, a difference of 0.050%), and Immigrants from Lebanon (83.4%, a difference of 0.070%).
| Demographics | Rating | Rank | In Labor Force | Age 25-29 |
| Cubans | 0.1 /100 | #265 | Tragic 83.5% |
| Aleuts | 0.0 /100 | #266 | Tragic 83.4% |
| Spanish Americans | 0.0 /100 | #267 | Tragic 83.4% |
| Immigrants | Lebanon | 0.0 /100 | #268 | Tragic 83.4% |
| Immigrants | Barbados | 0.0 /100 | #269 | Tragic 83.4% |
| Basques | 0.0 /100 | #270 | Tragic 83.4% |
| Hondurans | 0.0 /100 | #271 | Tragic 83.4% |
| Immigrants | Caribbean | 0.0 /100 | #272 | Tragic 83.4% |
| Immigrants | Dominica | 0.0 /100 | #273 | Tragic 83.4% |
| Marshallese | 0.0 /100 | #274 | Tragic 83.3% |
| Samoans | 0.0 /100 | #275 | Tragic 83.3% |
| Immigrants | Honduras | 0.0 /100 | #276 | Tragic 83.3% |
| Africans | 0.0 /100 | #277 | Tragic 83.2% |
| Immigrants | Cuba | 0.0 /100 | #278 | Tragic 83.2% |
| British West Indians | 0.0 /100 | #279 | Tragic 83.2% |
Demographics Similar to South Americans by In Labor Force | Age 25-29
In terms of in labor force | age 25-29, the demographic groups most similar to South Americans are Immigrants from Spain (84.7%, a difference of 0.010%), Indonesian (84.7%, a difference of 0.010%), Argentinean (84.7%, a difference of 0.020%), Ghanaian (84.7%, a difference of 0.020%), and Immigrants from Burma/Myanmar (84.7%, a difference of 0.020%).
| Demographics | Rating | Rank | In Labor Force | Age 25-29 |
| Canadians | 58.5 /100 | #161 | Average 84.7% |
| Immigrants | Colombia | 58.3 /100 | #162 | Average 84.7% |
| Argentineans | 57.9 /100 | #163 | Average 84.7% |
| Ghanaians | 57.6 /100 | #164 | Average 84.7% |
| Immigrants | Burma/Myanmar | 57.4 /100 | #165 | Average 84.7% |
| Immigrants | Spain | 56.9 /100 | #166 | Average 84.7% |
| Indonesians | 56.5 /100 | #167 | Average 84.7% |
| South Americans | 54.9 /100 | #168 | Average 84.7% |
| Celtics | 52.5 /100 | #169 | Average 84.7% |
| Tongans | 52.4 /100 | #170 | Average 84.7% |
| Immigrants | Vietnam | 50.5 /100 | #171 | Average 84.7% |
| Immigrants | Western Europe | 50.4 /100 | #172 | Average 84.7% |
| Assyrians/Chaldeans/Syriacs | 50.2 /100 | #173 | Average 84.7% |
| Palestinians | 50.0 /100 | #174 | Average 84.7% |
| Hungarians | 47.8 /100 | #175 | Average 84.6% |