Immigrants from Cameroon vs Spanish In Labor Force | Age 16-19
COMPARE
Immigrants from Cameroon
Spanish
In Labor Force | Age 16-19
In Labor Force | Age 16-19 Comparison
Immigrants from Cameroon
Spanish
38.7%
IN LABOR FORCE | AGE 16-19
99.0/ 100
METRIC RATING
103rd/ 347
METRIC RANK
39.3%
IN LABOR FORCE | AGE 16-19
99.7/ 100
METRIC RATING
83rd/ 347
METRIC RANK
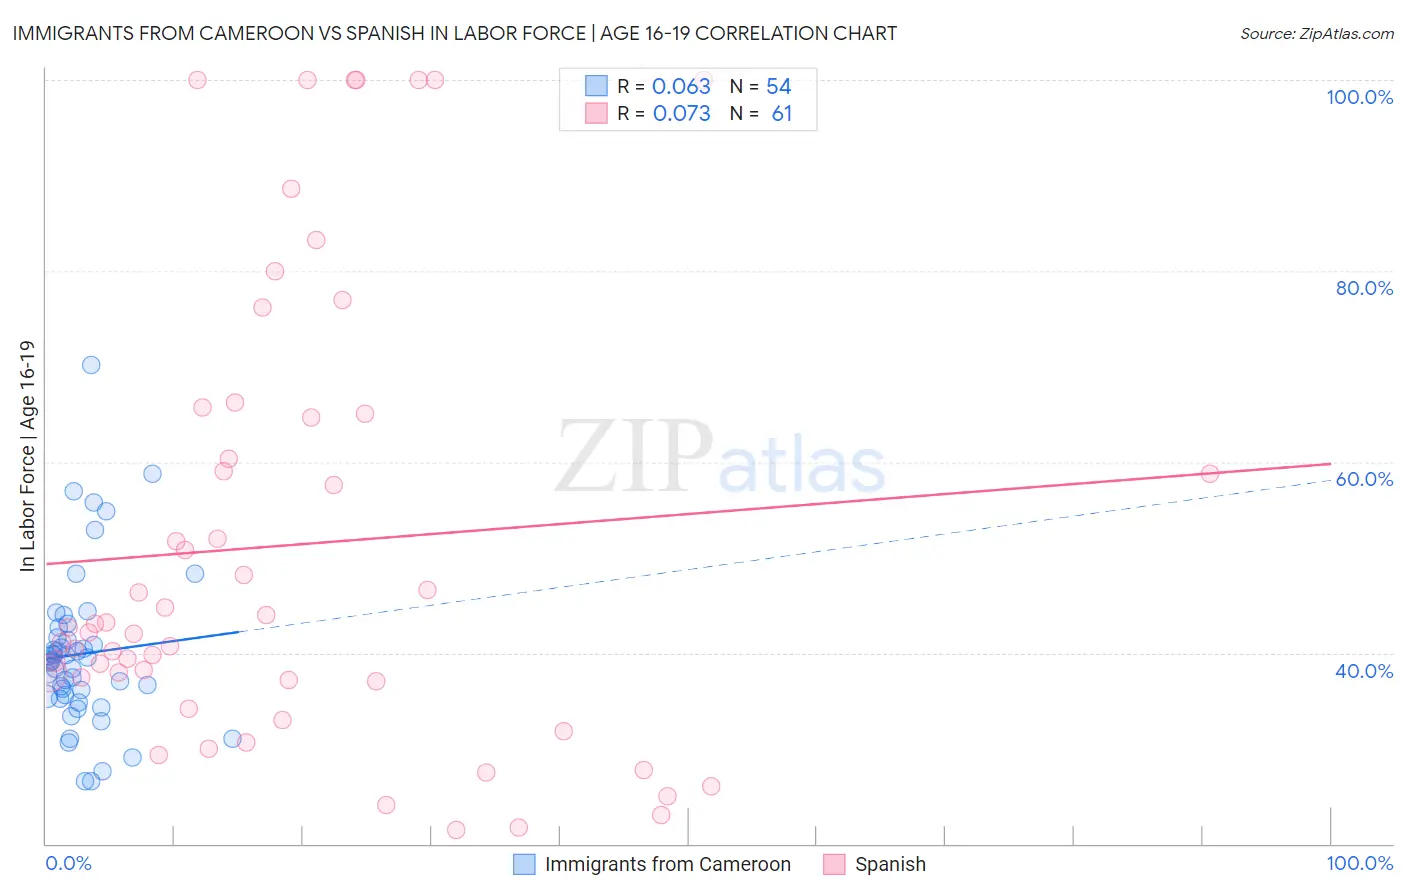
Immigrants from Cameroon vs Spanish In Labor Force | Age 16-19 Correlation Chart
The statistical analysis conducted on geographies consisting of 130,719,565 people shows a slight positive correlation between the proportion of Immigrants from Cameroon and labor force participation rate among population between the ages 16 and 19 in the United States with a correlation coefficient (R) of 0.063 and weighted average of 38.7%. Similarly, the statistical analysis conducted on geographies consisting of 421,181,243 people shows a slight positive correlation between the proportion of Spanish and labor force participation rate among population between the ages 16 and 19 in the United States with a correlation coefficient (R) of 0.073 and weighted average of 39.3%, a difference of 1.4%.
In Labor Force | Age 16-19 Correlation Summary
| Measurement | Immigrants from Cameroon | Spanish |
| Minimum | 26.5% | 21.4% |
| Maximum | 70.1% | 100.0% |
| Range | 43.6% | 78.6% |
| Mean | 39.9% | 51.3% |
| Median | 39.2% | 42.7% |
| Interquartile 25% (IQ1) | 35.5% | 37.1% |
| Interquartile 75% (IQ3) | 41.6% | 64.9% |
| Interquartile Range (IQR) | 6.1% | 27.8% |
| Standard Deviation (Sample) | 8.3% | 23.5% |
| Standard Deviation (Population) | 8.2% | 23.3% |
Demographics Similar to Immigrants from Cameroon and Spanish by In Labor Force | Age 16-19
In terms of in labor force | age 16-19, the demographic groups most similar to Immigrants from Cameroon are Zimbabwean (38.7%, a difference of 0.030%), Hmong (38.7%, a difference of 0.040%), Immigrants from Thailand (38.7%, a difference of 0.11%), Immigrants from North Macedonia (38.9%, a difference of 0.40%), and Ugandan (38.9%, a difference of 0.42%). Similarly, the demographic groups most similar to Spanish are Immigrants from Uganda (39.2%, a difference of 0.13%), Creek (39.1%, a difference of 0.28%), Samoan (39.1%, a difference of 0.30%), Immigrants from Germany (39.1%, a difference of 0.38%), and Puget Sound Salish (39.1%, a difference of 0.45%).
| Demographics | Rating | Rank | In Labor Force | Age 16-19 |
| Spanish | 99.7 /100 | #83 | Exceptional 39.3% |
| Immigrants | Uganda | 99.7 /100 | #84 | Exceptional 39.2% |
| Creek | 99.6 /100 | #85 | Exceptional 39.1% |
| Samoans | 99.6 /100 | #86 | Exceptional 39.1% |
| Immigrants | Germany | 99.6 /100 | #87 | Exceptional 39.1% |
| Puget Sound Salish | 99.6 /100 | #88 | Exceptional 39.1% |
| Alaska Natives | 99.6 /100 | #89 | Exceptional 39.1% |
| Immigrants | Burma/Myanmar | 99.5 /100 | #90 | Exceptional 39.0% |
| Spanish Americans | 99.5 /100 | #91 | Exceptional 39.0% |
| Osage | 99.4 /100 | #92 | Exceptional 39.0% |
| Blackfeet | 99.4 /100 | #93 | Exceptional 38.9% |
| Immigrants | Canada | 99.4 /100 | #94 | Exceptional 38.9% |
| Immigrants | North America | 99.4 /100 | #95 | Exceptional 38.9% |
| Latvians | 99.4 /100 | #96 | Exceptional 38.9% |
| Greeks | 99.3 /100 | #97 | Exceptional 38.9% |
| Ugandans | 99.3 /100 | #98 | Exceptional 38.9% |
| Immigrants | North Macedonia | 99.3 /100 | #99 | Exceptional 38.9% |
| Immigrants | Thailand | 99.1 /100 | #100 | Exceptional 38.7% |
| Hmong | 99.1 /100 | #101 | Exceptional 38.7% |
| Zimbabweans | 99.1 /100 | #102 | Exceptional 38.7% |
| Immigrants | Cameroon | 99.0 /100 | #103 | Exceptional 38.7% |