Immigrants from Cameroon vs Hopi In Labor Force | Age > 16
COMPARE
Immigrants from Cameroon
Hopi
In Labor Force | Age > 16
In Labor Force | Age > 16 Comparison
Immigrants from Cameroon
Hopi
68.7%
IN LABOR FORCE | AGE > 16
100.0/ 100
METRIC RATING
7th/ 347
METRIC RANK
58.4%
IN LABOR FORCE | AGE > 16
0.0/ 100
METRIC RATING
341st/ 347
METRIC RANK
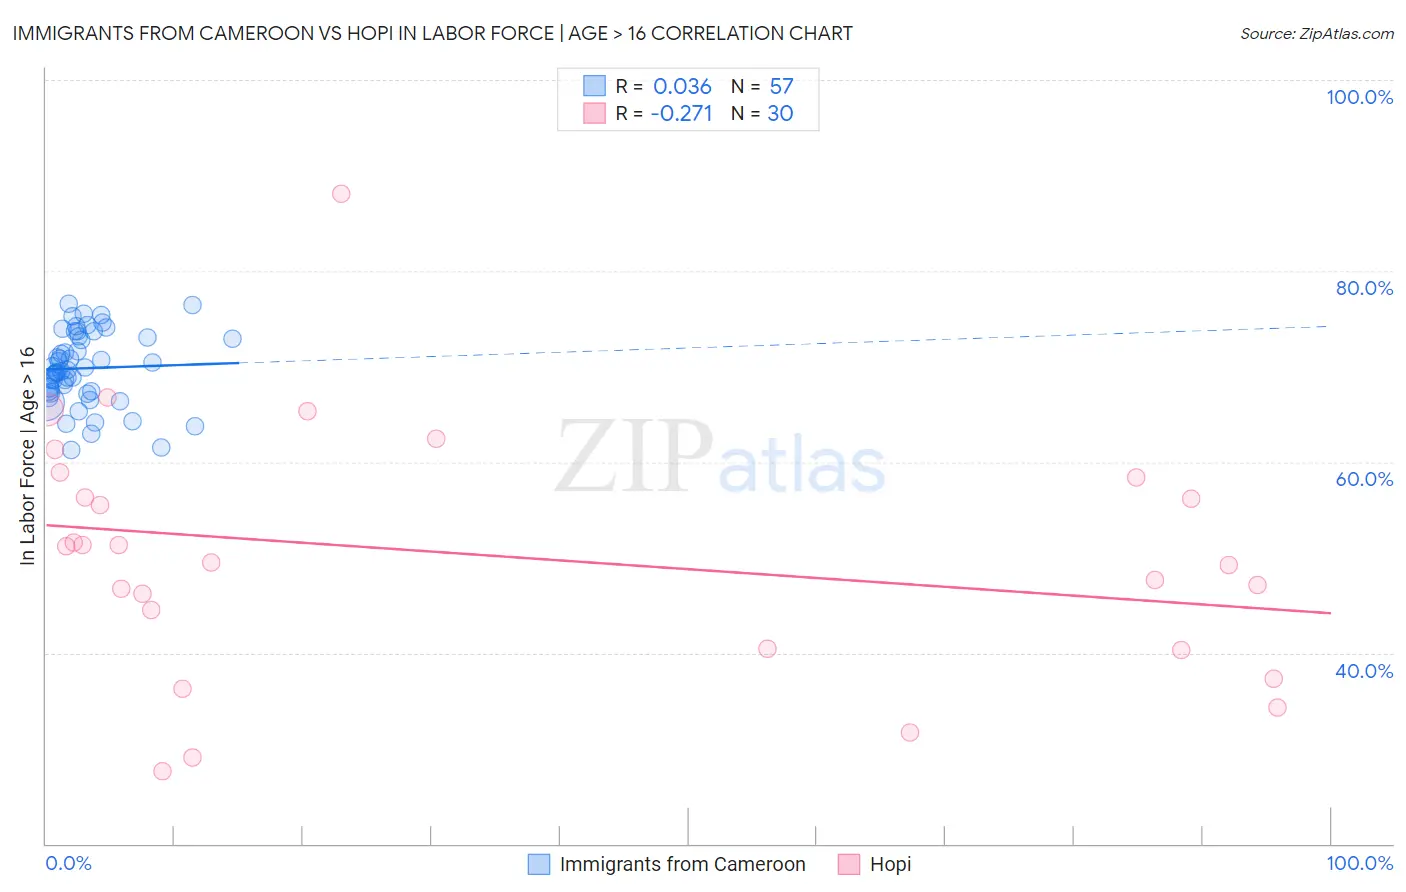
Immigrants from Cameroon vs Hopi In Labor Force | Age > 16 Correlation Chart
The statistical analysis conducted on geographies consisting of 130,760,472 people shows no correlation between the proportion of Immigrants from Cameroon and labor force participation rate among population ages 16 and over in the United States with a correlation coefficient (R) of 0.036 and weighted average of 68.7%. Similarly, the statistical analysis conducted on geographies consisting of 74,733,532 people shows a weak negative correlation between the proportion of Hopi and labor force participation rate among population ages 16 and over in the United States with a correlation coefficient (R) of -0.271 and weighted average of 58.4%, a difference of 17.7%.
In Labor Force | Age > 16 Correlation Summary
| Measurement | Immigrants from Cameroon | Hopi |
| Minimum | 61.3% | 27.6% |
| Maximum | 76.5% | 88.1% |
| Range | 15.3% | 60.5% |
| Mean | 69.8% | 50.2% |
| Median | 69.7% | 50.4% |
| Interquartile 25% (IQ1) | 67.3% | 40.4% |
| Interquartile 75% (IQ3) | 73.1% | 58.3% |
| Interquartile Range (IQR) | 5.7% | 17.9% |
| Standard Deviation (Sample) | 3.8% | 13.0% |
| Standard Deviation (Population) | 3.8% | 12.8% |
Similar Demographics by In Labor Force | Age > 16
Demographics Similar to Immigrants from Cameroon by In Labor Force | Age > 16
In terms of in labor force | age > 16, the demographic groups most similar to Immigrants from Cameroon are Immigrants from Eritrea (68.9%, a difference of 0.25%), Sierra Leonean (68.9%, a difference of 0.30%), Immigrants from Sierra Leone (68.5%, a difference of 0.32%), Immigrants from Eastern Africa (68.5%, a difference of 0.33%), and Immigrants from Bolivia (68.4%, a difference of 0.36%).
| Demographics | Rating | Rank | In Labor Force | Age > 16 |
| Immigrants | Ethiopia | 100.0 /100 | #1 | Exceptional 69.4% |
| Ethiopians | 100.0 /100 | #2 | Exceptional 69.3% |
| Somalis | 100.0 /100 | #3 | Exceptional 69.2% |
| Immigrants | Somalia | 100.0 /100 | #4 | Exceptional 69.1% |
| Sierra Leoneans | 100.0 /100 | #5 | Exceptional 68.9% |
| Immigrants | Eritrea | 100.0 /100 | #6 | Exceptional 68.9% |
| Immigrants | Cameroon | 100.0 /100 | #7 | Exceptional 68.7% |
| Immigrants | Sierra Leone | 100.0 /100 | #8 | Exceptional 68.5% |
| Immigrants | Eastern Africa | 100.0 /100 | #9 | Exceptional 68.5% |
| Immigrants | Bolivia | 100.0 /100 | #10 | Exceptional 68.4% |
| Bolivians | 100.0 /100 | #11 | Exceptional 68.2% |
| Sudanese | 100.0 /100 | #12 | Exceptional 68.0% |
| Immigrants | Nepal | 100.0 /100 | #13 | Exceptional 68.0% |
| Liberians | 100.0 /100 | #14 | Exceptional 67.8% |
| Immigrants | Middle Africa | 100.0 /100 | #15 | Exceptional 67.7% |
Demographics Similar to Hopi by In Labor Force | Age > 16
In terms of in labor force | age > 16, the demographic groups most similar to Hopi are Puerto Rican (58.1%, a difference of 0.47%), Yuman (57.8%, a difference of 0.99%), Pueblo (59.3%, a difference of 1.5%), Pima (57.4%, a difference of 1.7%), and Houma (59.5%, a difference of 1.9%).
| Demographics | Rating | Rank | In Labor Force | Age > 16 |
| Paiute | 0.0 /100 | #333 | Tragic 60.7% |
| Apache | 0.0 /100 | #334 | Tragic 60.7% |
| Natives/Alaskans | 0.0 /100 | #335 | Tragic 60.6% |
| Menominee | 0.0 /100 | #336 | Tragic 60.6% |
| Colville | 0.0 /100 | #337 | Tragic 59.8% |
| Immigrants | Yemen | 0.0 /100 | #338 | Tragic 59.6% |
| Houma | 0.0 /100 | #339 | Tragic 59.5% |
| Pueblo | 0.0 /100 | #340 | Tragic 59.3% |
| Hopi | 0.0 /100 | #341 | Tragic 58.4% |
| Puerto Ricans | 0.0 /100 | #342 | Tragic 58.1% |
| Yuman | 0.0 /100 | #343 | Tragic 57.8% |
| Pima | 0.0 /100 | #344 | Tragic 57.4% |
| Tohono O'odham | 0.0 /100 | #345 | Tragic 57.2% |
| Lumbee | 0.0 /100 | #346 | Tragic 56.8% |
| Navajo | 0.0 /100 | #347 | Tragic 56.6% |