Immigrants from Cabo Verde vs Venezuelan In Labor Force | Age 20-64

COMPARE

Immigrants from Cabo Verde
Race
Ancestry
AfghanAfricanAlaska NativeAlaskan AthabascanAlbanianAleutAlsatianAmericanApacheArabArapahoArgentineanArmenianAssyrian/Chaldean/SyriacAustralianAustrianBahamianBangladeshiBarbadianBasqueBelgianBelizeanBermudanBhutaneseBlackfeetBolivianBrazilianBritishBritish West IndianBulgarianBurmeseCajunCambodianCanadianCape VerdeanCarpatho RusynCelticCentral AmericanCentral American IndianCherokeeCheyenneChickasawChileanChineseChippewaChoctawColombianColvilleComancheCosta RicanCreeCreekCroatianCrowCubanCypriotCzechCzechoslovakianDanishDelawareDominicanDutchDutch West IndianEastern EuropeanEcuadorianEgyptianEnglishEstonianEthiopianEuropeanFijianFilipinoFinnishFrenchFrench American IndianFrench CanadianGermanGerman RussianGhanaianGreekGuamanian/ChamorroGuatemalanGuyaneseHaitianHmongHonduranHopiHoumaHungarianIcelanderIndian (Asian)IndonesianInupiatIranianIraqiIrishIroquoisIsraeliItalianJamaicanJapaneseJordanianKenyanKiowaKoreanLaotianLatvianLebaneseLiberianLithuanianLumbeeLuxembourgerMacedonianMalaysianMalteseMarshalleseMenomineeMexicanMexican American IndianMongolianMoroccanNative HawaiianNavajoNepaleseNew ZealanderNicaraguanNigerianNorthern EuropeanNorwegianOkinawanOsageOttawaPaiutePakistaniPalestinianPanamanianParaguayanPennsylvania GermanPeruvianPimaPolishPortuguesePotawatomiPuebloPuerto RicanPuget Sound SalishRomanianRussianSalvadoranSamoanScandinavianScotch-IrishScottishSeminoleSenegaleseSerbianShoshoneSierra LeoneanSiouxSlavicSlovakSloveneSomaliSouth AfricanSouth AmericanSouth American IndianSoviet UnionSpaniardSpanishSpanish AmericanSpanish American IndianSri LankanSubsaharan AfricanSudaneseSwedishSwissSyrianTaiwaneseThaiTlingit-HaidaTohono O'OdhamTonganTrinidadian and TobagonianTsimshianTurkishU.S. Virgin IslanderUgandanUkrainianUruguayanUteVietnameseWelshWest IndianYakamaYaquiYugoslavianYumanYup'ikZimbabwean
Immigration
NonimmigrantsImmigrantsAfghanistanAfricaAlbaniaArgentinaArmeniaAsiaAustraliaAustriaBahamasBangladeshBarbadosBelarusBelgiumBelizeBoliviaBosnia and HerzegovinaBrazilBulgariaBurma/MyanmarCabo VerdeCambodiaCameroonCanadaCaribbeanCentral AmericaChileChinaColombiaCongoCosta RicaCroatiaCubaCzechoslovakiaDenmarkDominicaDominican RepublicEastern AfricaEastern AsiaEastern EuropeEcuadorEgyptEl SalvadorEnglandEritreaEthiopiaEuropeFijiFranceGermanyGhanaGreeceGrenadaGuatemalaGuyanaHaitiHondurasHong KongHungaryIndiaIndonesiaIranIraqIrelandIsraelItalyJamaicaJapanJordanKazakhstanKenyaKoreaKuwaitLaosLatin AmericaLatviaLebanonLiberiaLithuaniaMalaysiaMexicoMicronesiaMiddle AfricaMoldovaMoroccoNepalNetherlandsNicaraguaNigeriaNorth AmericaNorth MacedoniaNorthern AfricaNorthern EuropeNorwayOceaniaPakistanPanamaPeruPhilippinesPolandPortugalRomaniaRussiaSaudi ArabiaScotlandSenegalSerbiaSierra LeoneSingaporeSomaliaSouth AfricaSouth AmericaSouth Central AsiaSouth Eastern AsiaSouthern EuropeSpainSri LankaSt. Vincent and the GrenadinesSudanSwedenSwitzerlandSyriaTaiwanThailandTrinidad and TobagoTurkeyUgandaUkraineUruguayUzbekistanVenezuelaVietnamWest IndiesWestern AfricaWestern AsiaWestern EuropeYemenZaireZimbabweAzores
Venezuelan
Race
Ancestry
AfghanAfricanAlaska NativeAlaskan AthabascanAlbanianAleutAlsatianAmericanApacheArabArapahoArgentineanArmenianAssyrian/Chaldean/SyriacAustralianAustrianBahamianBangladeshiBarbadianBasqueBelgianBelizeanBermudanBhutaneseBlackfeetBolivianBrazilianBritishBritish West IndianBulgarianBurmeseCajunCambodianCanadianCape VerdeanCarpatho RusynCelticCentral AmericanCentral American IndianCherokeeCheyenneChickasawChileanChineseChippewaChoctawColombianColvilleComancheCosta RicanCreeCreekCroatianCrowCubanCypriotCzechCzechoslovakianDanishDelawareDominicanDutchDutch West IndianEastern EuropeanEcuadorianEgyptianEnglishEstonianEthiopianEuropeanFijianFilipinoFinnishFrenchFrench American IndianFrench CanadianGermanGerman RussianGhanaianGreekGuamanian/ChamorroGuatemalanGuyaneseHaitianHmongHonduranHopiHoumaHungarianIcelanderIndian (Asian)IndonesianInupiatIranianIraqiIrishIroquoisIsraeliItalianJamaicanJapaneseJordanianKenyanKiowaKoreanLaotianLatvianLebaneseLiberianLithuanianLumbeeLuxembourgerMacedonianMalaysianMalteseMarshalleseMenomineeMexicanMexican American IndianMongolianMoroccanNative HawaiianNavajoNepaleseNew ZealanderNicaraguanNigerianNorthern EuropeanNorwegianOkinawanOsageOttawaPaiutePakistaniPalestinianPanamanianParaguayanPennsylvania GermanPeruvianPimaPolishPortuguesePotawatomiPuebloPuerto RicanPuget Sound SalishRomanianRussianSalvadoranSamoanScandinavianScotch-IrishScottishSeminoleSenegaleseSerbianShoshoneSierra LeoneanSiouxSlavicSlovakSloveneSomaliSouth AfricanSouth AmericanSouth American IndianSoviet UnionSpaniardSpanishSpanish AmericanSpanish American IndianSri LankanSubsaharan AfricanSudaneseSwedishSwissSyrianTaiwaneseThaiTlingit-HaidaTohono O'OdhamTonganTrinidadian and TobagonianTsimshianTurkishU.S. Virgin IslanderUgandanUkrainianUruguayanUteVenezuelanVietnameseWelshWest IndianYakamaYaquiYugoslavianYumanYup'ikZimbabwean
Immigration
NonimmigrantsImmigrantsAfghanistanAfricaAlbaniaArgentinaArmeniaAsiaAustraliaAustriaBahamasBangladeshBarbadosBelarusBelgiumBelizeBoliviaBosnia and HerzegovinaBrazilBulgariaBurma/MyanmarCambodiaCameroonCanadaCaribbeanCentral AmericaChileChinaColombiaCongoCosta RicaCroatiaCubaCzechoslovakiaDenmarkDominicaDominican RepublicEastern AfricaEastern AsiaEastern EuropeEcuadorEgyptEl SalvadorEnglandEritreaEthiopiaEuropeFijiFranceGermanyGhanaGreeceGrenadaGuatemalaGuyanaHaitiHondurasHong KongHungaryIndiaIndonesiaIranIraqIrelandIsraelItalyJamaicaJapanJordanKazakhstanKenyaKoreaKuwaitLaosLatin AmericaLatviaLebanonLiberiaLithuaniaMalaysiaMexicoMicronesiaMiddle AfricaMoldovaMoroccoNepalNetherlandsNicaraguaNigeriaNorth AmericaNorth MacedoniaNorthern AfricaNorthern EuropeNorwayOceaniaPakistanPanamaPeruPhilippinesPolandPortugalRomaniaRussiaSaudi ArabiaScotlandSenegalSerbiaSierra LeoneSingaporeSomaliaSouth AfricaSouth AmericaSouth Central AsiaSouth Eastern AsiaSouthern EuropeSpainSri LankaSt. Vincent and the GrenadinesSudanSwedenSwitzerlandSyriaTaiwanThailandTrinidad and TobagoTurkeyUgandaUkraineUruguayUzbekistanVenezuelaVietnamWest IndiesWestern AfricaWestern AsiaWestern EuropeYemenZaireZimbabweAzores
In Labor Force | Age 20-64
Income
Poverty
Unemployment
Labor Participation
Family Structure
Vehicle Availability
Education Level
Disability

In Labor Force | Age 20-64 Comparison

Immigrants from Cabo Verde

Venezuelans

Exceptional
Exceptional
80.3%
IN LABOR FORCE | AGE 20-64
99.0/ 100
METRIC RATING
55th/ 347
METRIC RANK
80.0%
IN LABOR FORCE | AGE 20-64
95.3/ 100
METRIC RATING
104th/ 347
METRIC RANK

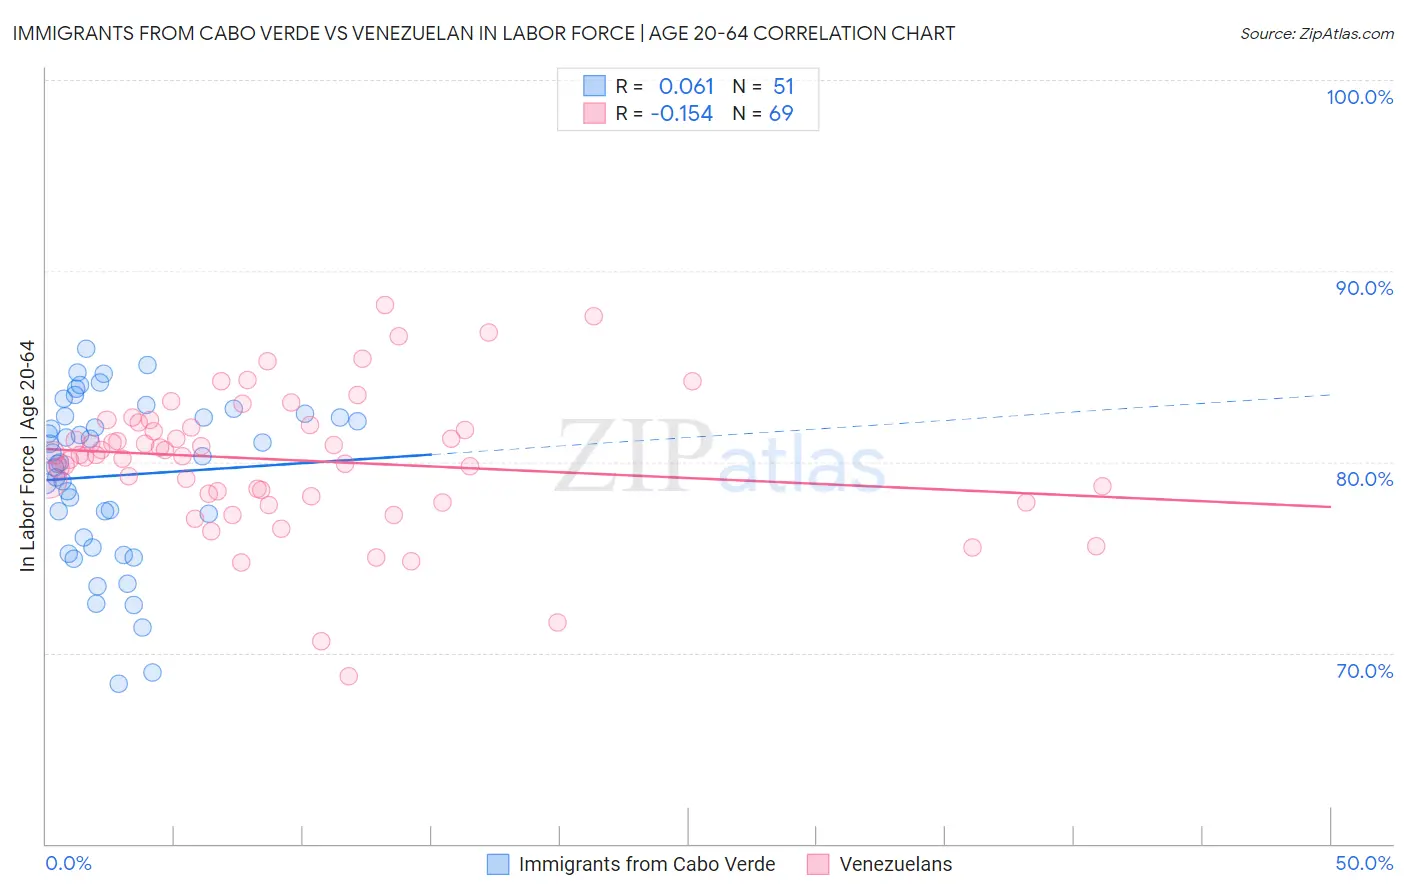
Immigrants from Cabo Verde vs Venezuelan In Labor Force | Age 20-64 Correlation Chart

The statistical analysis conducted on geographies consisting of 38,158,316 people shows a slight positive correlation between the proportion of Immigrants from Cabo Verde and labor force participation rate among population between the ages 20 and 64 in the United States with a correlation coefficient (R) of 0.061 and weighted average of 80.3%. Similarly, the statistical analysis conducted on geographies consisting of 306,339,015 people shows a poor negative correlation between the proportion of Venezuelans and labor force participation rate among population between the ages 20 and 64 in the United States with a correlation coefficient (R) of -0.154 and weighted average of 80.0%, a difference of 0.32%.
Immigrants from Cabo Verde vs Venezuelan In Labor Force | Age 20-64

In Labor Force | Age 20-64 Correlation Summary

MeasurementImmigrants from Cabo VerdeVenezuelan
Minimum68.4%68.8%
Maximum85.9%88.2%
Range17.5%19.4%
Mean79.3%80.1%
Median80.3%80.4%
Interquartile 25% (IQ1)76.0%78.3%
Interquartile 75% (IQ3)82.4%82.0%
Interquartile Range (IQR)6.4%3.7%
Standard Deviation (Sample)4.3%3.6%
Standard Deviation (Population)4.2%3.6%

Similar Demographics by In Labor Force | Age 20-64

Demographics Similar to Immigrants from Cabo Verde by In Labor Force | Age 20-64

In terms of in labor force | age 20-64, the demographic groups most similar to Immigrants from Cabo Verde are Immigrants from Northern Africa (80.3%, a difference of 0.010%), Afghan (80.3%, a difference of 0.010%), Peruvian (80.3%, a difference of 0.020%), Serbian (80.3%, a difference of 0.030%), and Swedish (80.3%, a difference of 0.030%).
DemographicsRating | RankIn Labor Force | Age 20-64
Immigrants | Hong Kong
99.5
/100
|
#48
Exceptional
80.4%
Immigrants | Greece
99.4
/100
|
#49
Exceptional
80.4%
Immigrants | Sudan
99.4
/100
|
#50
Exceptional
80.4%
Immigrants | Sri Lanka
99.3
/100
|
#51
Exceptional
80.4%
Turks
99.2
/100
|
#52
Exceptional
80.3%
Immigrants | Peru
99.2
/100
|
#53
Exceptional
80.3%
Peruvians
99.1
/100
|
#54
Exceptional
80.3%
Immigrants | Cabo Verde
99.0
/100
|
#55
Exceptional
80.3%
Immigrants | Northern Africa
99.0
/100
|
#56
Exceptional
80.3%
Afghans
98.9
/100
|
#57
Exceptional
80.3%
Serbians
98.9
/100
|
#58
Exceptional
80.3%
Swedes
98.9
/100
|
#59
Exceptional
80.3%
Tongans
98.8
/100
|
#60
Exceptional
80.3%
Burmese
98.8
/100
|
#61
Exceptional
80.3%
Carpatho Rusyns
98.8
/100
|
#62
Exceptional
80.3%

Demographics Similar to Venezuelans by In Labor Force | Age 20-64

In terms of in labor force | age 20-64, the demographic groups most similar to Venezuelans are Filipino (80.1%, a difference of 0.010%), Palestinian (80.0%, a difference of 0.010%), Immigrants from Australia (80.0%, a difference of 0.010%), Russian (80.0%, a difference of 0.010%), and Immigrants from Ghana (80.0%, a difference of 0.010%).
DemographicsRating | RankIn Labor Force | Age 20-64
South Americans
95.9
/100
|
#97
Exceptional
80.1%
Immigrants | Uruguay
95.8
/100
|
#98
Exceptional
80.1%
Immigrants | Chile
95.7
/100
|
#99
Exceptional
80.1%
Filipinos
95.6
/100
|
#100
Exceptional
80.1%
Palestinians
95.5
/100
|
#101
Exceptional
80.0%
Immigrants | Australia
95.5
/100
|
#102
Exceptional
80.0%
Russians
95.5
/100
|
#103
Exceptional
80.0%
Venezuelans
95.3
/100
|
#104
Exceptional
80.0%
Immigrants | Ghana
95.0
/100
|
#105
Exceptional
80.0%
Greeks
94.8
/100
|
#106
Exceptional
80.0%
Immigrants | Jordan
94.8
/100
|
#107
Exceptional
80.0%
Iranians
94.3
/100
|
#108
Exceptional
80.0%
Immigrants | Argentina
94.1
/100
|
#109
Exceptional
80.0%
Estonians
94.0
/100
|
#110
Exceptional
80.0%
Immigrants | South America
93.9
/100
|
#111
Exceptional
80.0%