Immigrants from Bulgaria vs Immigrants from Yemen In Labor Force | Age 16-19

COMPARE

Immigrants from Bulgaria
Race
Ancestry
AfghanAfricanAlaska NativeAlaskan AthabascanAlbanianAleutAlsatianAmericanApacheArabArapahoArgentineanArmenianAssyrian/Chaldean/SyriacAustralianAustrianBahamianBangladeshiBarbadianBasqueBelgianBelizeanBermudanBhutaneseBlackfeetBolivianBrazilianBritishBritish West IndianBulgarianBurmeseCajunCambodianCanadianCape VerdeanCarpatho RusynCelticCentral AmericanCentral American IndianCherokeeCheyenneChickasawChileanChineseChippewaChoctawColombianColvilleComancheCosta RicanCreeCreekCroatianCrowCubanCypriotCzechCzechoslovakianDanishDelawareDominicanDutchDutch West IndianEastern EuropeanEcuadorianEgyptianEnglishEstonianEthiopianEuropeanFijianFilipinoFinnishFrenchFrench American IndianFrench CanadianGermanGerman RussianGhanaianGreekGuamanian/ChamorroGuatemalanGuyaneseHaitianHmongHonduranHopiHoumaHungarianIcelanderIndian (Asian)IndonesianInupiatIranianIraqiIrishIroquoisIsraeliItalianJamaicanJapaneseJordanianKenyanKiowaKoreanLaotianLatvianLebaneseLiberianLithuanianLumbeeLuxembourgerMacedonianMalaysianMalteseMarshalleseMenomineeMexicanMexican American IndianMongolianMoroccanNative HawaiianNavajoNepaleseNew ZealanderNicaraguanNigerianNorthern EuropeanNorwegianOkinawanOsageOttawaPaiutePakistaniPalestinianPanamanianParaguayanPennsylvania GermanPeruvianPimaPolishPortuguesePotawatomiPuebloPuerto RicanPuget Sound SalishRomanianRussianSalvadoranSamoanScandinavianScotch-IrishScottishSeminoleSenegaleseSerbianShoshoneSierra LeoneanSiouxSlavicSlovakSloveneSomaliSouth AfricanSouth AmericanSouth American IndianSoviet UnionSpaniardSpanishSpanish AmericanSpanish American IndianSri LankanSubsaharan AfricanSudaneseSwedishSwissSyrianTaiwaneseThaiTlingit-HaidaTohono O'OdhamTonganTrinidadian and TobagonianTsimshianTurkishU.S. Virgin IslanderUgandanUkrainianUruguayanUteVenezuelanVietnameseWelshWest IndianYakamaYaquiYugoslavianYumanYup'ikZimbabwean
Immigration
NonimmigrantsImmigrantsAfghanistanAfricaAlbaniaArgentinaArmeniaAsiaAustraliaAustriaBahamasBangladeshBarbadosBelarusBelgiumBelizeBoliviaBosnia and HerzegovinaBrazilBulgariaBurma/MyanmarCabo VerdeCambodiaCameroonCanadaCaribbeanCentral AmericaChileChinaColombiaCongoCosta RicaCroatiaCubaCzechoslovakiaDenmarkDominicaDominican RepublicEastern AfricaEastern AsiaEastern EuropeEcuadorEgyptEl SalvadorEnglandEritreaEthiopiaEuropeFijiFranceGermanyGhanaGreeceGrenadaGuatemalaGuyanaHaitiHondurasHong KongHungaryIndiaIndonesiaIranIraqIrelandIsraelItalyJamaicaJapanJordanKazakhstanKenyaKoreaKuwaitLaosLatin AmericaLatviaLebanonLiberiaLithuaniaMalaysiaMexicoMicronesiaMiddle AfricaMoldovaMoroccoNepalNetherlandsNicaraguaNigeriaNorth AmericaNorth MacedoniaNorthern AfricaNorthern EuropeNorwayOceaniaPakistanPanamaPeruPhilippinesPolandPortugalRomaniaRussiaSaudi ArabiaScotlandSenegalSerbiaSierra LeoneSingaporeSomaliaSouth AfricaSouth AmericaSouth Central AsiaSouth Eastern AsiaSouthern EuropeSpainSri LankaSt. Vincent and the GrenadinesSudanSwedenSwitzerlandSyriaTaiwanThailandTrinidad and TobagoTurkeyUgandaUkraineUruguayUzbekistanVenezuelaVietnamWest IndiesWestern AfricaWestern AsiaWestern EuropeZaireZimbabweAzores
Immigrants from Yemen
Race
Ancestry
AfghanAfricanAlaska NativeAlaskan AthabascanAlbanianAleutAlsatianAmericanApacheArabArapahoArgentineanArmenianAssyrian/Chaldean/SyriacAustralianAustrianBahamianBangladeshiBarbadianBasqueBelgianBelizeanBermudanBhutaneseBlackfeetBolivianBrazilianBritishBritish West IndianBulgarianBurmeseCajunCambodianCanadianCape VerdeanCarpatho RusynCelticCentral AmericanCentral American IndianCherokeeCheyenneChickasawChileanChineseChippewaChoctawColombianColvilleComancheCosta RicanCreeCreekCroatianCrowCubanCypriotCzechCzechoslovakianDanishDelawareDominicanDutchDutch West IndianEastern EuropeanEcuadorianEgyptianEnglishEstonianEthiopianEuropeanFijianFilipinoFinnishFrenchFrench American IndianFrench CanadianGermanGerman RussianGhanaianGreekGuamanian/ChamorroGuatemalanGuyaneseHaitianHmongHonduranHopiHoumaHungarianIcelanderIndian (Asian)IndonesianInupiatIranianIraqiIrishIroquoisIsraeliItalianJamaicanJapaneseJordanianKenyanKiowaKoreanLaotianLatvianLebaneseLiberianLithuanianLumbeeLuxembourgerMacedonianMalaysianMalteseMarshalleseMenomineeMexicanMexican American IndianMongolianMoroccanNative HawaiianNavajoNepaleseNew ZealanderNicaraguanNigerianNorthern EuropeanNorwegianOkinawanOsageOttawaPaiutePakistaniPalestinianPanamanianParaguayanPennsylvania GermanPeruvianPimaPolishPortuguesePotawatomiPuebloPuerto RicanPuget Sound SalishRomanianRussianSalvadoranSamoanScandinavianScotch-IrishScottishSeminoleSenegaleseSerbianShoshoneSierra LeoneanSiouxSlavicSlovakSloveneSomaliSouth AfricanSouth AmericanSouth American IndianSoviet UnionSpaniardSpanishSpanish AmericanSpanish American IndianSri LankanSubsaharan AfricanSudaneseSwedishSwissSyrianTaiwaneseThaiTlingit-HaidaTohono O'OdhamTonganTrinidadian and TobagonianTsimshianTurkishU.S. Virgin IslanderUgandanUkrainianUruguayanUteVenezuelanVietnameseWelshWest IndianYakamaYaquiYugoslavianYumanYup'ikZimbabwean
Immigration
NonimmigrantsImmigrantsAfghanistanAfricaAlbaniaArgentinaArmeniaAsiaAustraliaAustriaBahamasBangladeshBarbadosBelarusBelgiumBelizeBoliviaBosnia and HerzegovinaBrazilBurma/MyanmarCabo VerdeCambodiaCameroonCanadaCaribbeanCentral AmericaChileChinaColombiaCongoCosta RicaCroatiaCubaCzechoslovakiaDenmarkDominicaDominican RepublicEastern AfricaEastern AsiaEastern EuropeEcuadorEgyptEl SalvadorEnglandEritreaEthiopiaEuropeFijiFranceGermanyGhanaGreeceGrenadaGuatemalaGuyanaHaitiHondurasHong KongHungaryIndiaIndonesiaIranIraqIrelandIsraelItalyJamaicaJapanJordanKazakhstanKenyaKoreaKuwaitLaosLatin AmericaLatviaLebanonLiberiaLithuaniaMalaysiaMexicoMicronesiaMiddle AfricaMoldovaMoroccoNepalNetherlandsNicaraguaNigeriaNorth AmericaNorth MacedoniaNorthern AfricaNorthern EuropeNorwayOceaniaPakistanPanamaPeruPhilippinesPolandPortugalRomaniaRussiaSaudi ArabiaScotlandSenegalSerbiaSierra LeoneSingaporeSomaliaSouth AfricaSouth AmericaSouth Central AsiaSouth Eastern AsiaSouthern EuropeSpainSri LankaSt. Vincent and the GrenadinesSudanSwedenSwitzerlandSyriaTaiwanThailandTrinidad and TobagoTurkeyUgandaUkraineUruguayUzbekistanVenezuelaVietnamWest IndiesWestern AfricaWestern AsiaWestern EuropeYemenZaireZimbabweAzores
In Labor Force | Age 16-19
Income
Poverty
Unemployment
Labor Participation
Family Structure
Vehicle Availability
Education Level
Disability

In Labor Force | Age 16-19 Comparison

Immigrants from Bulgaria

Immigrants from Yemen

Excellent
Tragic
37.3%
IN LABOR FORCE | AGE 16-19
81.6/ 100
METRIC RATING
154th/ 347
METRIC RANK
31.5%
IN LABOR FORCE | AGE 16-19
0.0/ 100
METRIC RATING
318th/ 347
METRIC RANK

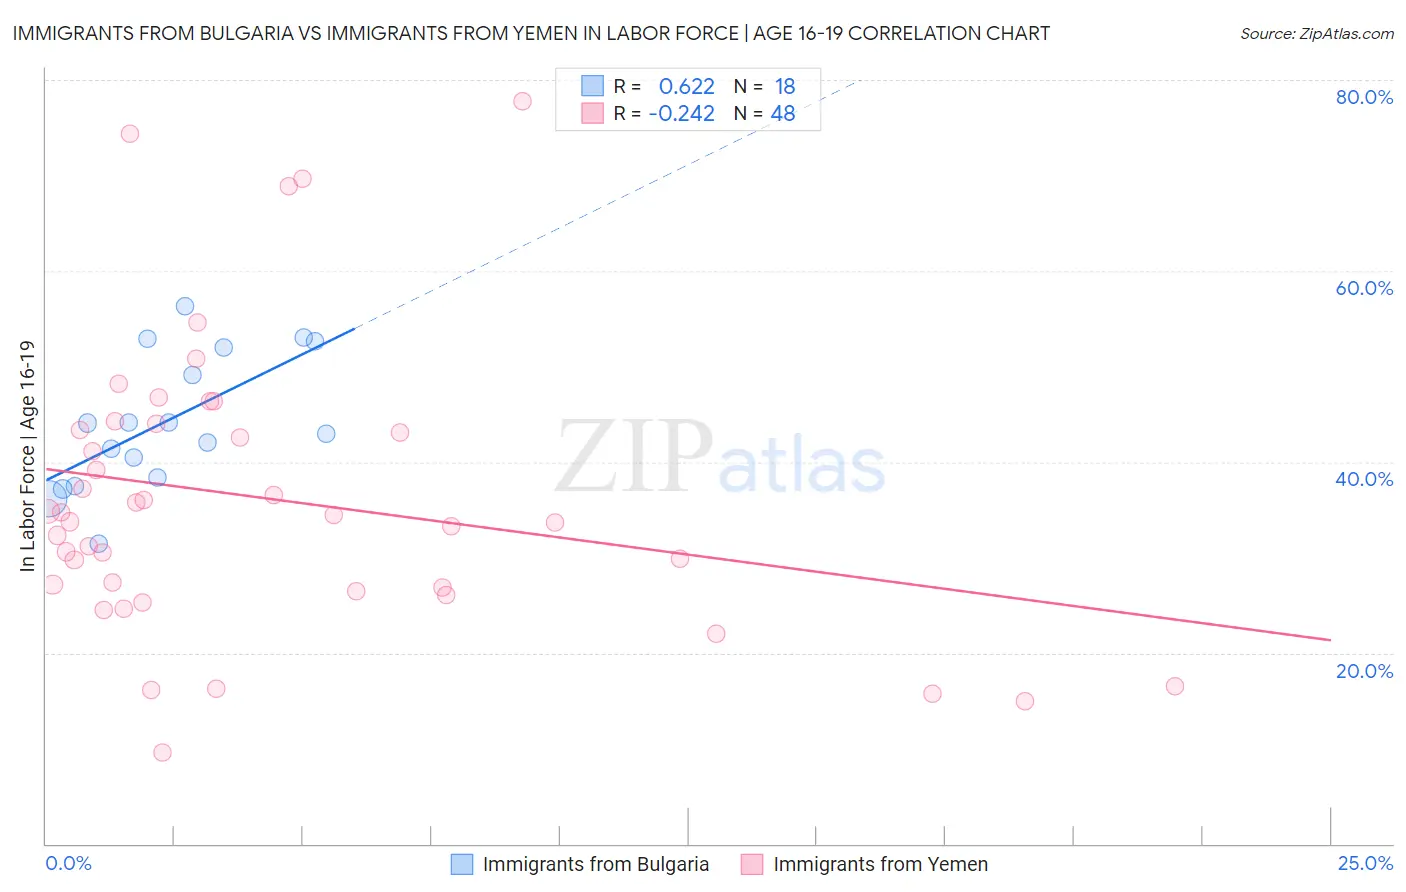
Immigrants from Bulgaria vs Immigrants from Yemen In Labor Force | Age 16-19 Correlation Chart

The statistical analysis conducted on geographies consisting of 172,373,837 people shows a significant positive correlation between the proportion of Immigrants from Bulgaria and labor force participation rate among population between the ages 16 and 19 in the United States with a correlation coefficient (R) of 0.622 and weighted average of 37.3%. Similarly, the statistical analysis conducted on geographies consisting of 82,404,771 people shows a weak negative correlation between the proportion of Immigrants from Yemen and labor force participation rate among population between the ages 16 and 19 in the United States with a correlation coefficient (R) of -0.242 and weighted average of 31.5%, a difference of 18.2%.
Immigrants from Bulgaria vs Immigrants from Yemen In Labor Force | Age 16-19

In Labor Force | Age 16-19 Correlation Summary

MeasurementImmigrants from BulgariaImmigrants from Yemen
Minimum31.4%9.6%
Maximum56.3%77.8%
Range24.8%68.2%
Mean44.2%36.1%
Median43.5%34.1%
Interquartile 25% (IQ1)38.4%26.6%
Interquartile 75% (IQ3)52.0%43.7%
Interquartile Range (IQR)13.6%17.0%
Standard Deviation (Sample)7.0%15.1%
Standard Deviation (Population)6.8%14.9%

Similar Demographics by In Labor Force | Age 16-19

Demographics Similar to Immigrants from Bulgaria by In Labor Force | Age 16-19

In terms of in labor force | age 16-19, the demographic groups most similar to Immigrants from Bulgaria are Arapaho (37.3%, a difference of 0.020%), Immigrants from Lithuania (37.2%, a difference of 0.070%), Kiowa (37.2%, a difference of 0.10%), Immigrants from Sierra Leone (37.3%, a difference of 0.17%), and Immigrants from Poland (37.3%, a difference of 0.25%).
DemographicsRating | RankIn Labor Force | Age 16-19
Brazilians
88.7
/100
|
#147
Excellent
37.5%
Romanians
87.3
/100
|
#148
Excellent
37.5%
Native Hawaiians
85.0
/100
|
#149
Excellent
37.4%
Tsimshian
84.7
/100
|
#150
Excellent
37.4%
Immigrants | Poland
84.4
/100
|
#151
Excellent
37.3%
Immigrants | Sierra Leone
83.6
/100
|
#152
Excellent
37.3%
Arapaho
81.8
/100
|
#153
Excellent
37.3%
Immigrants | Bulgaria
81.6
/100
|
#154
Excellent
37.3%
Immigrants | Lithuania
80.7
/100
|
#155
Excellent
37.2%
Kiowa
80.4
/100
|
#156
Excellent
37.2%
Immigrants | Brazil
76.5
/100
|
#157
Good
37.1%
Ute
75.7
/100
|
#158
Good
37.1%
Yaqui
74.4
/100
|
#159
Good
37.1%
Immigrants | Saudi Arabia
73.9
/100
|
#160
Good
37.0%
Cambodians
71.5
/100
|
#161
Good
37.0%

Demographics Similar to Immigrants from Yemen by In Labor Force | Age 16-19

In terms of in labor force | age 16-19, the demographic groups most similar to Immigrants from Yemen are Soviet Union (31.4%, a difference of 0.32%), Immigrants from Nicaragua (31.6%, a difference of 0.34%), Ecuadorian (31.4%, a difference of 0.38%), Filipino (31.7%, a difference of 0.53%), and Immigrants from West Indies (31.7%, a difference of 0.62%).
DemographicsRating | RankIn Labor Force | Age 16-19
Indians (Asian)
0.0
/100
|
#311
Tragic
31.9%
Immigrants | Belize
0.0
/100
|
#312
Tragic
31.8%
Hopi
0.0
/100
|
#313
Tragic
31.8%
Cubans
0.0
/100
|
#314
Tragic
31.8%
Immigrants | West Indies
0.0
/100
|
#315
Tragic
31.7%
Filipinos
0.0
/100
|
#316
Tragic
31.7%
Immigrants | Nicaragua
0.0
/100
|
#317
Tragic
31.6%
Immigrants | Yemen
0.0
/100
|
#318
Tragic
31.5%
Soviet Union
0.0
/100
|
#319
Tragic
31.4%
Ecuadorians
0.0
/100
|
#320
Tragic
31.4%
West Indians
0.0
/100
|
#321
Tragic
31.3%
Tohono O'odham
0.0
/100
|
#322
Tragic
31.3%
Immigrants | Caribbean
0.0
/100
|
#323
Tragic
31.2%
Dominicans
0.0
/100
|
#324
Tragic
31.2%
Immigrants | China
0.0
/100
|
#325
Tragic
31.1%