Immigrants from Bolivia vs Lumbee In Labor Force | Age 16-19

COMPARE

Immigrants from Bolivia
Race
Ancestry
AfghanAfricanAlaska NativeAlaskan AthabascanAlbanianAleutAlsatianAmericanApacheArabArapahoArgentineanArmenianAssyrian/Chaldean/SyriacAustralianAustrianBahamianBangladeshiBarbadianBasqueBelgianBelizeanBermudanBhutaneseBlackfeetBolivianBrazilianBritishBritish West IndianBulgarianBurmeseCajunCambodianCanadianCape VerdeanCarpatho RusynCelticCentral AmericanCentral American IndianCherokeeCheyenneChickasawChileanChineseChippewaChoctawColombianColvilleComancheCosta RicanCreeCreekCroatianCrowCubanCypriotCzechCzechoslovakianDanishDelawareDominicanDutchDutch West IndianEastern EuropeanEcuadorianEgyptianEnglishEstonianEthiopianEuropeanFijianFilipinoFinnishFrenchFrench American IndianFrench CanadianGermanGerman RussianGhanaianGreekGuamanian/ChamorroGuatemalanGuyaneseHaitianHmongHonduranHopiHoumaHungarianIcelanderIndian (Asian)IndonesianInupiatIranianIraqiIrishIroquoisIsraeliItalianJamaicanJapaneseJordanianKenyanKiowaKoreanLaotianLatvianLebaneseLiberianLithuanianLuxembourgerMacedonianMalaysianMalteseMarshalleseMenomineeMexicanMexican American IndianMongolianMoroccanNative HawaiianNavajoNepaleseNew ZealanderNicaraguanNigerianNorthern EuropeanNorwegianOkinawanOsageOttawaPaiutePakistaniPalestinianPanamanianParaguayanPennsylvania GermanPeruvianPimaPolishPortuguesePotawatomiPuebloPuerto RicanPuget Sound SalishRomanianRussianSalvadoranSamoanScandinavianScotch-IrishScottishSeminoleSenegaleseSerbianShoshoneSierra LeoneanSiouxSlavicSlovakSloveneSomaliSouth AfricanSouth AmericanSouth American IndianSoviet UnionSpaniardSpanishSpanish AmericanSpanish American IndianSri LankanSubsaharan AfricanSudaneseSwedishSwissSyrianTaiwaneseThaiTlingit-HaidaTohono O'OdhamTonganTrinidadian and TobagonianTsimshianTurkishU.S. Virgin IslanderUgandanUkrainianUruguayanUteVenezuelanVietnameseWelshWest IndianYakamaYaquiYugoslavianYumanYup'ikZimbabwean
Immigration
NonimmigrantsImmigrantsAfghanistanAfricaAlbaniaArgentinaArmeniaAsiaAustraliaAustriaBahamasBangladeshBarbadosBelarusBelgiumBelizeBoliviaBosnia and HerzegovinaBrazilBulgariaBurma/MyanmarCabo VerdeCambodiaCameroonCanadaCaribbeanCentral AmericaChileChinaColombiaCongoCosta RicaCroatiaCubaCzechoslovakiaDenmarkDominicaDominican RepublicEastern AfricaEastern AsiaEastern EuropeEcuadorEgyptEl SalvadorEnglandEritreaEthiopiaEuropeFijiFranceGermanyGhanaGreeceGrenadaGuatemalaGuyanaHaitiHondurasHong KongHungaryIndiaIndonesiaIranIraqIrelandIsraelItalyJamaicaJapanJordanKazakhstanKenyaKoreaKuwaitLaosLatin AmericaLatviaLebanonLiberiaLithuaniaMalaysiaMexicoMicronesiaMiddle AfricaMoldovaMoroccoNepalNetherlandsNicaraguaNigeriaNorth AmericaNorth MacedoniaNorthern AfricaNorthern EuropeNorwayOceaniaPakistanPanamaPeruPhilippinesPolandPortugalRomaniaRussiaSaudi ArabiaScotlandSenegalSerbiaSierra LeoneSingaporeSomaliaSouth AfricaSouth AmericaSouth Central AsiaSouth Eastern AsiaSouthern EuropeSpainSri LankaSt. Vincent and the GrenadinesSudanSwedenSwitzerlandSyriaTaiwanThailandTrinidad and TobagoTurkeyUgandaUkraineUruguayUzbekistanVenezuelaVietnamWest IndiesWestern AfricaWestern AsiaWestern EuropeYemenZaireZimbabweAzores
Lumbee
Race
Ancestry
AfghanAfricanAlaska NativeAlaskan AthabascanAlbanianAleutAlsatianAmericanApacheArabArapahoArgentineanArmenianAssyrian/Chaldean/SyriacAustralianAustrianBahamianBangladeshiBarbadianBasqueBelgianBelizeanBermudanBhutaneseBlackfeetBolivianBrazilianBritishBritish West IndianBulgarianBurmeseCajunCambodianCanadianCape VerdeanCarpatho RusynCelticCentral AmericanCentral American IndianCherokeeCheyenneChickasawChileanChineseChippewaChoctawColombianColvilleComancheCosta RicanCreeCreekCroatianCrowCubanCypriotCzechCzechoslovakianDanishDelawareDominicanDutchDutch West IndianEastern EuropeanEcuadorianEgyptianEnglishEstonianEthiopianEuropeanFijianFilipinoFinnishFrenchFrench American IndianFrench CanadianGermanGerman RussianGhanaianGreekGuamanian/ChamorroGuatemalanGuyaneseHaitianHmongHonduranHopiHoumaHungarianIcelanderIndian (Asian)IndonesianInupiatIranianIraqiIrishIroquoisIsraeliItalianJamaicanJapaneseJordanianKenyanKiowaKoreanLaotianLatvianLebaneseLiberianLithuanianLumbeeLuxembourgerMacedonianMalaysianMalteseMarshalleseMenomineeMexicanMexican American IndianMongolianMoroccanNative HawaiianNavajoNepaleseNew ZealanderNicaraguanNigerianNorthern EuropeanNorwegianOkinawanOsageOttawaPaiutePakistaniPalestinianPanamanianParaguayanPennsylvania GermanPeruvianPimaPolishPortuguesePotawatomiPuebloPuerto RicanPuget Sound SalishRomanianRussianSalvadoranSamoanScandinavianScotch-IrishScottishSeminoleSenegaleseSerbianShoshoneSierra LeoneanSiouxSlavicSlovakSloveneSomaliSouth AfricanSouth AmericanSouth American IndianSoviet UnionSpaniardSpanishSpanish AmericanSpanish American IndianSri LankanSubsaharan AfricanSudaneseSwedishSwissSyrianTaiwaneseThaiTlingit-HaidaTohono O'OdhamTonganTrinidadian and TobagonianTsimshianTurkishU.S. Virgin IslanderUgandanUkrainianUruguayanUteVenezuelanVietnameseWelshWest IndianYakamaYaquiYugoslavianYumanYup'ikZimbabwean
Immigration
NonimmigrantsImmigrantsAfghanistanAfricaAlbaniaArgentinaArmeniaAsiaAustraliaAustriaBahamasBangladeshBarbadosBelarusBelgiumBelizeBosnia and HerzegovinaBrazilBulgariaBurma/MyanmarCabo VerdeCambodiaCameroonCanadaCaribbeanCentral AmericaChileChinaColombiaCongoCosta RicaCroatiaCubaCzechoslovakiaDenmarkDominicaDominican RepublicEastern AfricaEastern AsiaEastern EuropeEcuadorEgyptEl SalvadorEnglandEritreaEthiopiaEuropeFijiFranceGermanyGhanaGreeceGrenadaGuatemalaGuyanaHaitiHondurasHong KongHungaryIndiaIndonesiaIranIraqIrelandIsraelItalyJamaicaJapanJordanKazakhstanKenyaKoreaKuwaitLaosLatin AmericaLatviaLebanonLiberiaLithuaniaMalaysiaMexicoMicronesiaMiddle AfricaMoldovaMoroccoNepalNetherlandsNicaraguaNigeriaNorth AmericaNorth MacedoniaNorthern AfricaNorthern EuropeNorwayOceaniaPakistanPanamaPeruPhilippinesPolandPortugalRomaniaRussiaSaudi ArabiaScotlandSenegalSerbiaSierra LeoneSingaporeSomaliaSouth AfricaSouth AmericaSouth Central AsiaSouth Eastern AsiaSouthern EuropeSpainSri LankaSt. Vincent and the GrenadinesSudanSwedenSwitzerlandSyriaTaiwanThailandTrinidad and TobagoTurkeyUgandaUkraineUruguayUzbekistanVenezuelaVietnamWest IndiesWestern AfricaWestern AsiaWestern EuropeYemenZaireZimbabweAzores
In Labor Force | Age 16-19
Income
Poverty
Unemployment
Labor Participation
Family Structure
Vehicle Availability
Education Level
Disability

In Labor Force | Age 16-19 Comparison

Immigrants from Bolivia

Lumbee

Poor
Tragic
35.6%
IN LABOR FORCE | AGE 16-19
11.0/ 100
METRIC RATING
213th/ 347
METRIC RANK
31.0%
IN LABOR FORCE | AGE 16-19
0.0/ 100
METRIC RATING
330th/ 347
METRIC RANK

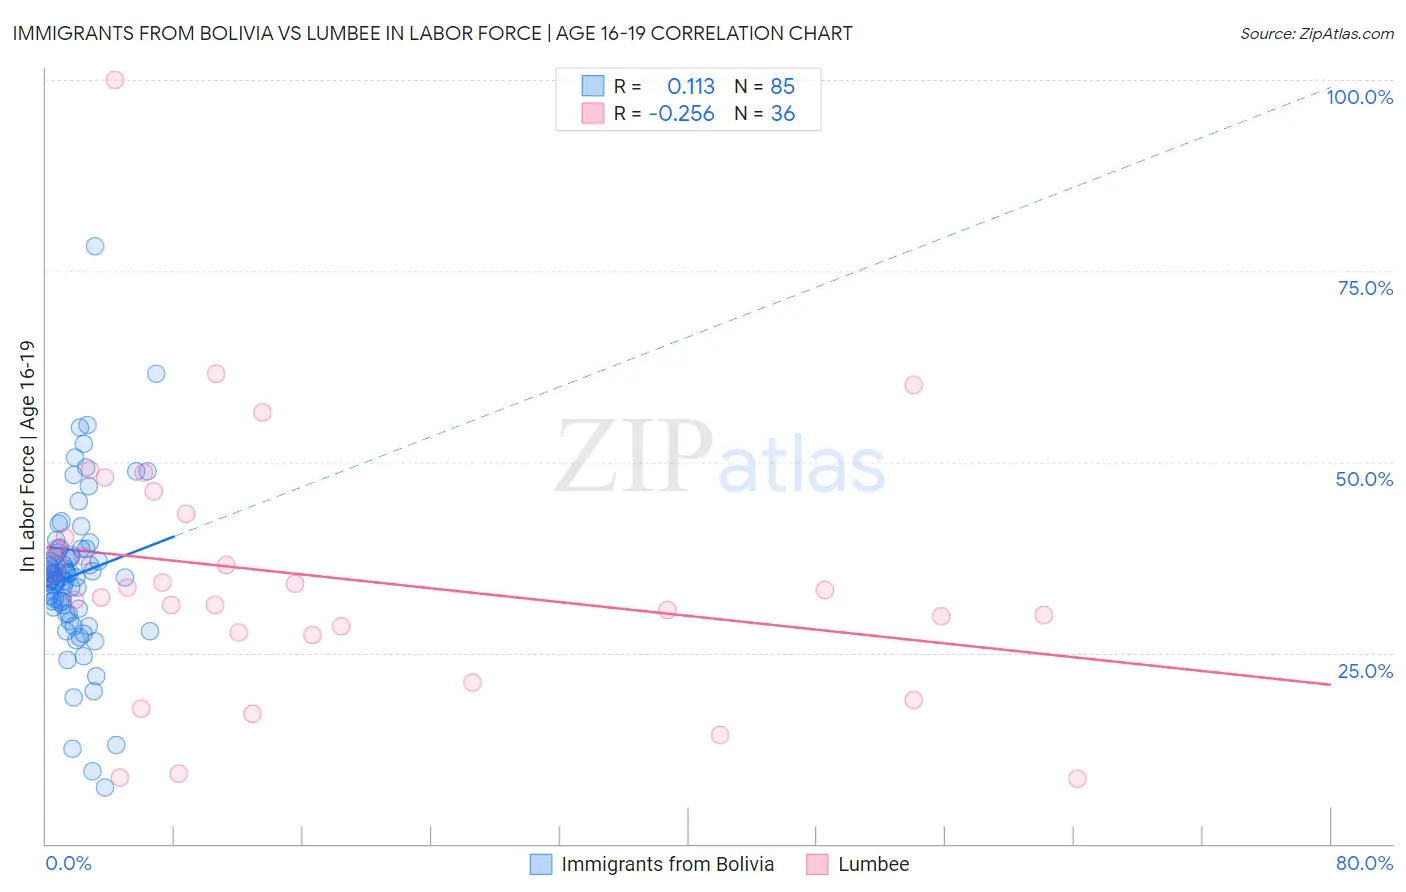
Immigrants from Bolivia vs Lumbee In Labor Force | Age 16-19 Correlation Chart

The statistical analysis conducted on geographies consisting of 158,606,636 people shows a poor positive correlation between the proportion of Immigrants from Bolivia and labor force participation rate among population between the ages 16 and 19 in the United States with a correlation coefficient (R) of 0.113 and weighted average of 35.6%. Similarly, the statistical analysis conducted on geographies consisting of 92,241,195 people shows a weak negative correlation between the proportion of Lumbee and labor force participation rate among population between the ages 16 and 19 in the United States with a correlation coefficient (R) of -0.256 and weighted average of 31.0%, a difference of 15.0%.
Immigrants from Bolivia vs Lumbee In Labor Force | Age 16-19

In Labor Force | Age 16-19 Correlation Summary

MeasurementImmigrants from BoliviaLumbee
Minimum7.3%8.5%
Maximum78.3%100.0%
Range71.0%91.5%
Mean35.2%34.8%
Median34.9%32.7%
Interquartile 25% (IQ1)30.9%27.5%
Interquartile 75% (IQ3)38.4%41.7%
Interquartile Range (IQR)7.5%14.2%
Standard Deviation (Sample)10.4%17.4%
Standard Deviation (Population)10.3%17.2%

Similar Demographics by In Labor Force | Age 16-19

Demographics Similar to Immigrants from Bolivia by In Labor Force | Age 16-19

In terms of in labor force | age 16-19, the demographic groups most similar to Immigrants from Bolivia are Houma (35.6%, a difference of 0.0%), Apache (35.6%, a difference of 0.010%), Immigrants from South Eastern Asia (35.6%, a difference of 0.030%), Dutch West Indian (35.6%, a difference of 0.050%), and Immigrants from Costa Rica (35.6%, a difference of 0.050%).
DemographicsRating | RankIn Labor Force | Age 16-19
Chileans
14.6
/100
|
#206
Poor
35.8%
Immigrants | Eastern Europe
14.5
/100
|
#207
Poor
35.8%
Koreans
13.3
/100
|
#208
Poor
35.7%
Moroccans
12.7
/100
|
#209
Poor
35.7%
Immigrants | Switzerland
11.9
/100
|
#210
Poor
35.6%
Mexicans
11.9
/100
|
#211
Poor
35.6%
Houma
11.0
/100
|
#212
Poor
35.6%
Immigrants | Bolivia
11.0
/100
|
#213
Poor
35.6%
Apache
11.0
/100
|
#214
Poor
35.6%
Immigrants | South Eastern Asia
10.8
/100
|
#215
Poor
35.6%
Dutch West Indians
10.7
/100
|
#216
Poor
35.6%
Immigrants | Costa Rica
10.7
/100
|
#217
Poor
35.6%
Sri Lankans
9.8
/100
|
#218
Tragic
35.5%
Guatemalans
8.6
/100
|
#219
Tragic
35.5%
Immigrants | Bahamas
8.3
/100
|
#220
Tragic
35.5%

Demographics Similar to Lumbee by In Labor Force | Age 16-19

In terms of in labor force | age 16-19, the demographic groups most similar to Lumbee are Barbadian (31.0%, a difference of 0.12%), Immigrants from Ecuador (31.0%, a difference of 0.15%), Trinidadian and Tobagonian (30.9%, a difference of 0.15%), Immigrants from Taiwan (31.0%, a difference of 0.19%), and Immigrants from Dominican Republic (31.1%, a difference of 0.35%).
DemographicsRating | RankIn Labor Force | Age 16-19
Immigrants | Caribbean
0.0
/100
|
#323
Tragic
31.2%
Dominicans
0.0
/100
|
#324
Tragic
31.2%
Immigrants | China
0.0
/100
|
#325
Tragic
31.1%
Immigrants | Dominican Republic
0.0
/100
|
#326
Tragic
31.1%
Immigrants | Taiwan
0.0
/100
|
#327
Tragic
31.0%
Immigrants | Ecuador
0.0
/100
|
#328
Tragic
31.0%
Barbadians
0.0
/100
|
#329
Tragic
31.0%
Lumbee
0.0
/100
|
#330
Tragic
31.0%
Trinidadians and Tobagonians
0.0
/100
|
#331
Tragic
30.9%
Immigrants | Israel
0.0
/100
|
#332
Tragic
30.5%
Immigrants | Hong Kong
0.0
/100
|
#333
Tragic
30.5%
Puerto Ricans
0.0
/100
|
#334
Tragic
30.3%
Immigrants | Cuba
0.0
/100
|
#335
Tragic
30.2%
Immigrants | Trinidad and Tobago
0.0
/100
|
#336
Tragic
30.2%
Immigrants | Bangladesh
0.0
/100
|
#337
Tragic
30.0%