Immigrants from Bolivia vs Immigrants from Egypt In Labor Force | Age > 16

COMPARE

Immigrants from Bolivia
Race
Ancestry
AfghanAfricanAlaska NativeAlaskan AthabascanAlbanianAleutAlsatianAmericanApacheArabArapahoArgentineanArmenianAssyrian/Chaldean/SyriacAustralianAustrianBahamianBangladeshiBarbadianBasqueBelgianBelizeanBermudanBhutaneseBlackfeetBolivianBrazilianBritishBritish West IndianBulgarianBurmeseCajunCambodianCanadianCape VerdeanCarpatho RusynCelticCentral AmericanCentral American IndianCherokeeCheyenneChickasawChileanChineseChippewaChoctawColombianColvilleComancheCosta RicanCreeCreekCroatianCrowCubanCypriotCzechCzechoslovakianDanishDelawareDominicanDutchDutch West IndianEastern EuropeanEcuadorianEgyptianEnglishEstonianEthiopianEuropeanFijianFilipinoFinnishFrenchFrench American IndianFrench CanadianGermanGerman RussianGhanaianGreekGuamanian/ChamorroGuatemalanGuyaneseHaitianHmongHonduranHopiHoumaHungarianIcelanderIndian (Asian)IndonesianInupiatIranianIraqiIrishIroquoisIsraeliItalianJamaicanJapaneseJordanianKenyanKiowaKoreanLaotianLatvianLebaneseLiberianLithuanianLumbeeLuxembourgerMacedonianMalaysianMalteseMarshalleseMenomineeMexicanMexican American IndianMongolianMoroccanNative HawaiianNavajoNepaleseNew ZealanderNicaraguanNigerianNorthern EuropeanNorwegianOkinawanOsageOttawaPaiutePakistaniPalestinianPanamanianParaguayanPennsylvania GermanPeruvianPimaPolishPortuguesePotawatomiPuebloPuerto RicanPuget Sound SalishRomanianRussianSalvadoranSamoanScandinavianScotch-IrishScottishSeminoleSenegaleseSerbianShoshoneSierra LeoneanSiouxSlavicSlovakSloveneSomaliSouth AfricanSouth AmericanSouth American IndianSoviet UnionSpaniardSpanishSpanish AmericanSpanish American IndianSri LankanSubsaharan AfricanSudaneseSwedishSwissSyrianTaiwaneseThaiTlingit-HaidaTohono O'OdhamTonganTrinidadian and TobagonianTsimshianTurkishU.S. Virgin IslanderUgandanUkrainianUruguayanUteVenezuelanVietnameseWelshWest IndianYakamaYaquiYugoslavianYumanYup'ikZimbabwean
Immigration
NonimmigrantsImmigrantsAfghanistanAfricaAlbaniaArgentinaArmeniaAsiaAustraliaAustriaBahamasBangladeshBarbadosBelarusBelgiumBelizeBoliviaBosnia and HerzegovinaBrazilBulgariaBurma/MyanmarCabo VerdeCambodiaCameroonCanadaCaribbeanCentral AmericaChileChinaColombiaCongoCosta RicaCroatiaCubaCzechoslovakiaDenmarkDominicaDominican RepublicEastern AfricaEastern AsiaEastern EuropeEcuadorEl SalvadorEnglandEritreaEthiopiaEuropeFijiFranceGermanyGhanaGreeceGrenadaGuatemalaGuyanaHaitiHondurasHong KongHungaryIndiaIndonesiaIranIraqIrelandIsraelItalyJamaicaJapanJordanKazakhstanKenyaKoreaKuwaitLaosLatin AmericaLatviaLebanonLiberiaLithuaniaMalaysiaMexicoMicronesiaMiddle AfricaMoldovaMoroccoNepalNetherlandsNicaraguaNigeriaNorth AmericaNorth MacedoniaNorthern AfricaNorthern EuropeNorwayOceaniaPakistanPanamaPeruPhilippinesPolandPortugalRomaniaRussiaSaudi ArabiaScotlandSenegalSerbiaSierra LeoneSingaporeSomaliaSouth AfricaSouth AmericaSouth Central AsiaSouth Eastern AsiaSouthern EuropeSpainSri LankaSt. Vincent and the GrenadinesSudanSwedenSwitzerlandSyriaTaiwanThailandTrinidad and TobagoTurkeyUgandaUkraineUruguayUzbekistanVenezuelaVietnamWest IndiesWestern AfricaWestern AsiaWestern EuropeYemenZaireZimbabweAzores
Immigrants from Egypt
Race
Ancestry
AfghanAfricanAlaska NativeAlaskan AthabascanAlbanianAleutAlsatianAmericanApacheArabArapahoArgentineanArmenianAssyrian/Chaldean/SyriacAustralianAustrianBahamianBangladeshiBarbadianBasqueBelgianBelizeanBermudanBhutaneseBlackfeetBolivianBrazilianBritishBritish West IndianBulgarianBurmeseCajunCambodianCanadianCape VerdeanCarpatho RusynCelticCentral AmericanCentral American IndianCherokeeCheyenneChickasawChileanChineseChippewaChoctawColombianColvilleComancheCosta RicanCreeCreekCroatianCrowCubanCypriotCzechCzechoslovakianDanishDelawareDominicanDutchDutch West IndianEastern EuropeanEcuadorianEgyptianEnglishEstonianEthiopianEuropeanFijianFilipinoFinnishFrenchFrench American IndianFrench CanadianGermanGerman RussianGhanaianGreekGuamanian/ChamorroGuatemalanGuyaneseHaitianHmongHonduranHopiHoumaHungarianIcelanderIndian (Asian)IndonesianInupiatIranianIraqiIrishIroquoisIsraeliItalianJamaicanJapaneseJordanianKenyanKiowaKoreanLaotianLatvianLebaneseLiberianLithuanianLumbeeLuxembourgerMacedonianMalaysianMalteseMarshalleseMenomineeMexicanMexican American IndianMongolianMoroccanNative HawaiianNavajoNepaleseNew ZealanderNicaraguanNigerianNorthern EuropeanNorwegianOkinawanOsageOttawaPaiutePakistaniPalestinianPanamanianParaguayanPennsylvania GermanPeruvianPimaPolishPortuguesePotawatomiPuebloPuerto RicanPuget Sound SalishRomanianRussianSalvadoranSamoanScandinavianScotch-IrishScottishSeminoleSenegaleseSerbianShoshoneSierra LeoneanSiouxSlavicSlovakSloveneSomaliSouth AfricanSouth AmericanSouth American IndianSoviet UnionSpaniardSpanishSpanish AmericanSpanish American IndianSri LankanSubsaharan AfricanSudaneseSwedishSwissSyrianTaiwaneseThaiTlingit-HaidaTohono O'OdhamTonganTrinidadian and TobagonianTsimshianTurkishU.S. Virgin IslanderUgandanUkrainianUruguayanUteVenezuelanVietnameseWelshWest IndianYakamaYaquiYugoslavianYumanYup'ikZimbabwean
Immigration
NonimmigrantsImmigrantsAfghanistanAfricaAlbaniaArgentinaArmeniaAsiaAustraliaAustriaBahamasBangladeshBarbadosBelarusBelgiumBelizeBosnia and HerzegovinaBrazilBulgariaBurma/MyanmarCabo VerdeCambodiaCameroonCanadaCaribbeanCentral AmericaChileChinaColombiaCongoCosta RicaCroatiaCubaCzechoslovakiaDenmarkDominicaDominican RepublicEastern AfricaEastern AsiaEastern EuropeEcuadorEgyptEl SalvadorEnglandEritreaEthiopiaEuropeFijiFranceGermanyGhanaGreeceGrenadaGuatemalaGuyanaHaitiHondurasHong KongHungaryIndiaIndonesiaIranIraqIrelandIsraelItalyJamaicaJapanJordanKazakhstanKenyaKoreaKuwaitLaosLatin AmericaLatviaLebanonLiberiaLithuaniaMalaysiaMexicoMicronesiaMiddle AfricaMoldovaMoroccoNepalNetherlandsNicaraguaNigeriaNorth AmericaNorth MacedoniaNorthern AfricaNorthern EuropeNorwayOceaniaPakistanPanamaPeruPhilippinesPolandPortugalRomaniaRussiaSaudi ArabiaScotlandSenegalSerbiaSierra LeoneSingaporeSomaliaSouth AfricaSouth AmericaSouth Central AsiaSouth Eastern AsiaSouthern EuropeSpainSri LankaSt. Vincent and the GrenadinesSudanSwedenSwitzerlandSyriaTaiwanThailandTrinidad and TobagoTurkeyUgandaUkraineUruguayUzbekistanVenezuelaVietnamWest IndiesWestern AfricaWestern AsiaWestern EuropeYemenZaireZimbabweAzores
In Labor Force | Age > 16
Income
Poverty
Unemployment
Labor Participation
Family Structure
Vehicle Availability
Education Level
Disability

In Labor Force | Age > 16 Comparison

Immigrants from Bolivia

Immigrants from Egypt

Exceptional
Exceptional
68.4%
IN LABOR FORCE | AGE > 16
100.0/ 100
METRIC RATING
10th/ 347
METRIC RANK
66.2%
IN LABOR FORCE | AGE > 16
99.7/ 100
METRIC RATING
68th/ 347
METRIC RANK

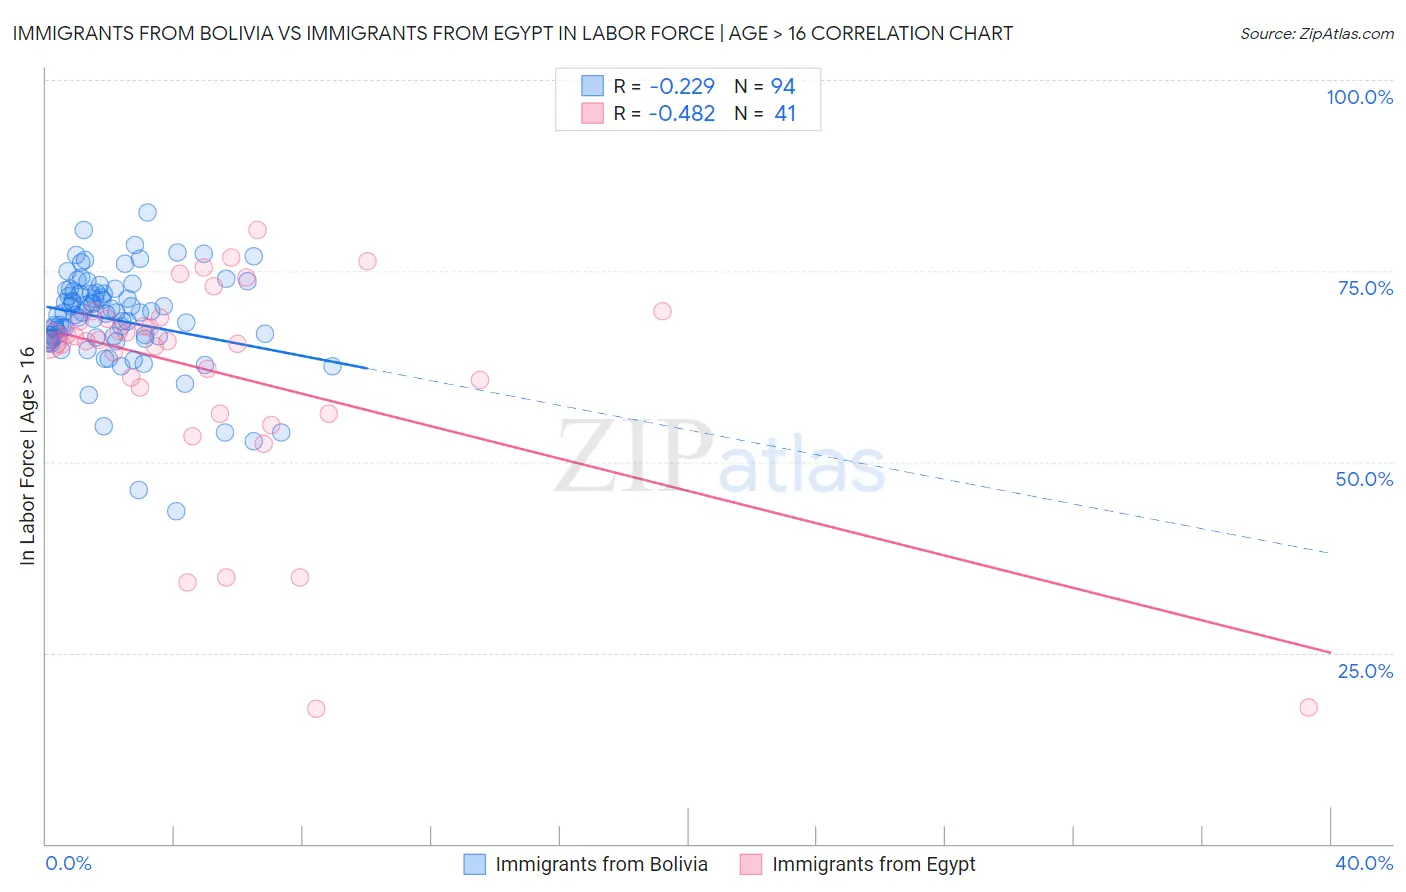
Immigrants from Bolivia vs Immigrants from Egypt In Labor Force | Age > 16 Correlation Chart

The statistical analysis conducted on geographies consisting of 158,722,448 people shows a weak negative correlation between the proportion of Immigrants from Bolivia and labor force participation rate among population ages 16 and over in the United States with a correlation coefficient (R) of -0.229 and weighted average of 68.4%. Similarly, the statistical analysis conducted on geographies consisting of 245,493,461 people shows a moderate negative correlation between the proportion of Immigrants from Egypt and labor force participation rate among population ages 16 and over in the United States with a correlation coefficient (R) of -0.482 and weighted average of 66.2%, a difference of 3.4%.
Immigrants from Bolivia vs Immigrants from Egypt In Labor Force | Age > 16

In Labor Force | Age > 16 Correlation Summary

MeasurementImmigrants from BoliviaImmigrants from Egypt
Minimum43.5%17.6%
Maximum82.6%80.4%
Range39.1%62.8%
Mean68.6%61.6%
Median69.4%65.8%
Interquartile 25% (IQ1)66.2%58.0%
Interquartile 75% (IQ3)72.1%68.8%
Interquartile Range (IQR)5.9%10.8%
Standard Deviation (Sample)6.5%14.4%
Standard Deviation (Population)6.4%14.3%

Similar Demographics by In Labor Force | Age > 16

Demographics Similar to Immigrants from Bolivia by In Labor Force | Age > 16

In terms of in labor force | age > 16, the demographic groups most similar to Immigrants from Bolivia are Immigrants from Eastern Africa (68.5%, a difference of 0.030%), Immigrants from Sierra Leone (68.5%, a difference of 0.050%), Immigrants from Cameroon (68.7%, a difference of 0.36%), Bolivian (68.2%, a difference of 0.37%), and Sudanese (68.0%, a difference of 0.59%).
DemographicsRating | RankIn Labor Force | Age > 16
Somalis
100.0
/100
|
#3
Exceptional
69.2%
Immigrants | Somalia
100.0
/100
|
#4
Exceptional
69.1%
Sierra Leoneans
100.0
/100
|
#5
Exceptional
68.9%
Immigrants | Eritrea
100.0
/100
|
#6
Exceptional
68.9%
Immigrants | Cameroon
100.0
/100
|
#7
Exceptional
68.7%
Immigrants | Sierra Leone
100.0
/100
|
#8
Exceptional
68.5%
Immigrants | Eastern Africa
100.0
/100
|
#9
Exceptional
68.5%
Immigrants | Bolivia
100.0
/100
|
#10
Exceptional
68.4%
Bolivians
100.0
/100
|
#11
Exceptional
68.2%
Sudanese
100.0
/100
|
#12
Exceptional
68.0%
Immigrants | Nepal
100.0
/100
|
#13
Exceptional
68.0%
Liberians
100.0
/100
|
#14
Exceptional
67.8%
Immigrants | Middle Africa
100.0
/100
|
#15
Exceptional
67.7%
Immigrants | Sudan
100.0
/100
|
#16
Exceptional
67.7%
Immigrants | India
100.0
/100
|
#17
Exceptional
67.6%

Demographics Similar to Immigrants from Egypt by In Labor Force | Age > 16

In terms of in labor force | age > 16, the demographic groups most similar to Immigrants from Egypt are Subsaharan African (66.2%, a difference of 0.0%), Asian (66.2%, a difference of 0.010%), Burmese (66.2%, a difference of 0.030%), Taiwanese (66.2%, a difference of 0.030%), and Immigrants from Vietnam (66.2%, a difference of 0.040%).
DemographicsRating | RankIn Labor Force | Age > 16
Immigrants | Burma/Myanmar
99.8
/100
|
#61
Exceptional
66.3%
Indonesians
99.8
/100
|
#62
Exceptional
66.3%
Venezuelans
99.8
/100
|
#63
Exceptional
66.3%
Peruvians
99.8
/100
|
#64
Exceptional
66.3%
Sri Lankans
99.8
/100
|
#65
Exceptional
66.3%
Jordanians
99.8
/100
|
#66
Exceptional
66.3%
Egyptians
99.8
/100
|
#67
Exceptional
66.2%
Immigrants | Egypt
99.7
/100
|
#68
Exceptional
66.2%
Sub-Saharan Africans
99.7
/100
|
#69
Exceptional
66.2%
Asians
99.7
/100
|
#70
Exceptional
66.2%
Burmese
99.7
/100
|
#71
Exceptional
66.2%
Taiwanese
99.7
/100
|
#72
Exceptional
66.2%
Immigrants | Vietnam
99.7
/100
|
#73
Exceptional
66.2%
Immigrants | Korea
99.7
/100
|
#74
Exceptional
66.2%
Immigrants | Singapore
99.7
/100
|
#75
Exceptional
66.2%