Immigrants from Belgium vs Immigrants from Denmark In Labor Force | Age 20-64
COMPARE
Immigrants from Belgium
Immigrants from Denmark
In Labor Force | Age 20-64
In Labor Force | Age 20-64 Comparison
Immigrants from Belgium
Immigrants from Denmark
79.6%
IN LABOR FORCE | AGE 20-64
53.1/ 100
METRIC RATING
172nd/ 347
METRIC RANK
79.4%
IN LABOR FORCE | AGE 20-64
26.9/ 100
METRIC RATING
192nd/ 347
METRIC RANK
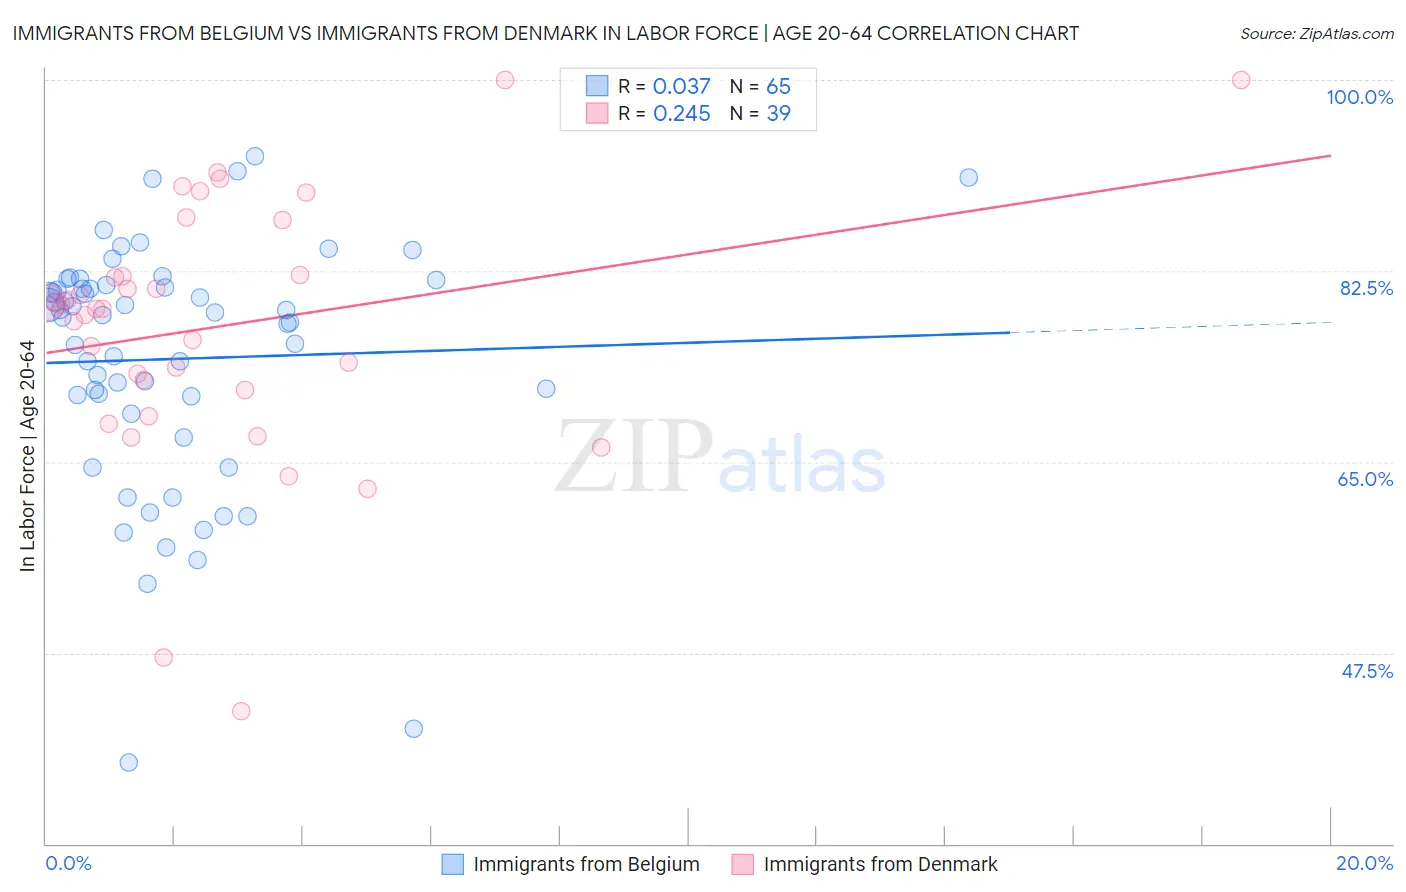
Immigrants from Belgium vs Immigrants from Denmark In Labor Force | Age 20-64 Correlation Chart
The statistical analysis conducted on geographies consisting of 146,728,908 people shows no correlation between the proportion of Immigrants from Belgium and labor force participation rate among population between the ages 20 and 64 in the United States with a correlation coefficient (R) of 0.037 and weighted average of 79.6%. Similarly, the statistical analysis conducted on geographies consisting of 136,432,253 people shows a weak positive correlation between the proportion of Immigrants from Denmark and labor force participation rate among population between the ages 20 and 64 in the United States with a correlation coefficient (R) of 0.245 and weighted average of 79.4%, a difference of 0.23%.
In Labor Force | Age 20-64 Correlation Summary
| Measurement | Immigrants from Belgium | Immigrants from Denmark |
| Minimum | 37.4% | 42.1% |
| Maximum | 93.0% | 100.0% |
| Range | 55.6% | 57.9% |
| Mean | 74.4% | 77.4% |
| Median | 78.5% | 79.1% |
| Interquartile 25% (IQ1) | 70.2% | 71.6% |
| Interquartile 75% (IQ3) | 81.1% | 82.1% |
| Interquartile Range (IQR) | 10.9% | 10.5% |
| Standard Deviation (Sample) | 11.2% | 11.9% |
| Standard Deviation (Population) | 11.1% | 11.7% |
Demographics Similar to Immigrants from Belgium and Immigrants from Denmark by In Labor Force | Age 20-64
In terms of in labor force | age 20-64, the demographic groups most similar to Immigrants from Belgium are Immigrants from Scotland (79.6%, a difference of 0.010%), Syrian (79.6%, a difference of 0.030%), Cuban (79.5%, a difference of 0.060%), Australian (79.5%, a difference of 0.060%), and Immigrants from Netherlands (79.5%, a difference of 0.060%). Similarly, the demographic groups most similar to Immigrants from Denmark are Swiss (79.4%, a difference of 0.020%), Immigrants from El Salvador (79.4%, a difference of 0.040%), Immigrants from Syria (79.4%, a difference of 0.040%), Immigrants from Haiti (79.4%, a difference of 0.050%), and Assyrian/Chaldean/Syriac (79.4%, a difference of 0.060%).
| Demographics | Rating | Rank | In Labor Force | Age 20-64 |
| Immigrants | Belgium | 53.1 /100 | #172 | Average 79.6% |
| Immigrants | Scotland | 52.4 /100 | #173 | Average 79.6% |
| Syrians | 50.0 /100 | #174 | Average 79.6% |
| Cubans | 46.1 /100 | #175 | Average 79.5% |
| Australians | 46.0 /100 | #176 | Average 79.5% |
| Immigrants | Netherlands | 45.2 /100 | #177 | Average 79.5% |
| Czechoslovakians | 44.3 /100 | #178 | Average 79.5% |
| Armenians | 41.4 /100 | #179 | Average 79.5% |
| Salvadorans | 41.0 /100 | #180 | Average 79.5% |
| Immigrants | Saudi Arabia | 37.7 /100 | #181 | Fair 79.5% |
| Malaysians | 37.1 /100 | #182 | Fair 79.5% |
| Immigrants | Hungary | 36.8 /100 | #183 | Fair 79.5% |
| Finns | 35.9 /100 | #184 | Fair 79.5% |
| Israelis | 34.7 /100 | #185 | Fair 79.5% |
| Northern Europeans | 34.5 /100 | #186 | Fair 79.5% |
| Assyrians/Chaldeans/Syriacs | 33.3 /100 | #187 | Fair 79.4% |
| Immigrants | Haiti | 32.1 /100 | #188 | Fair 79.4% |
| Immigrants | El Salvador | 30.9 /100 | #189 | Fair 79.4% |
| Immigrants | Syria | 30.8 /100 | #190 | Fair 79.4% |
| Swiss | 28.9 /100 | #191 | Fair 79.4% |
| Immigrants | Denmark | 26.9 /100 | #192 | Fair 79.4% |