Immigrants from Bangladesh vs Yaqui In Labor Force | Age 16-19
COMPARE
Immigrants from Bangladesh
Yaqui
In Labor Force | Age 16-19
In Labor Force | Age 16-19 Comparison
Immigrants from Bangladesh
Yaqui
30.0%
IN LABOR FORCE | AGE 16-19
0.0/ 100
METRIC RATING
337th/ 347
METRIC RANK
37.1%
IN LABOR FORCE | AGE 16-19
74.4/ 100
METRIC RATING
159th/ 347
METRIC RANK
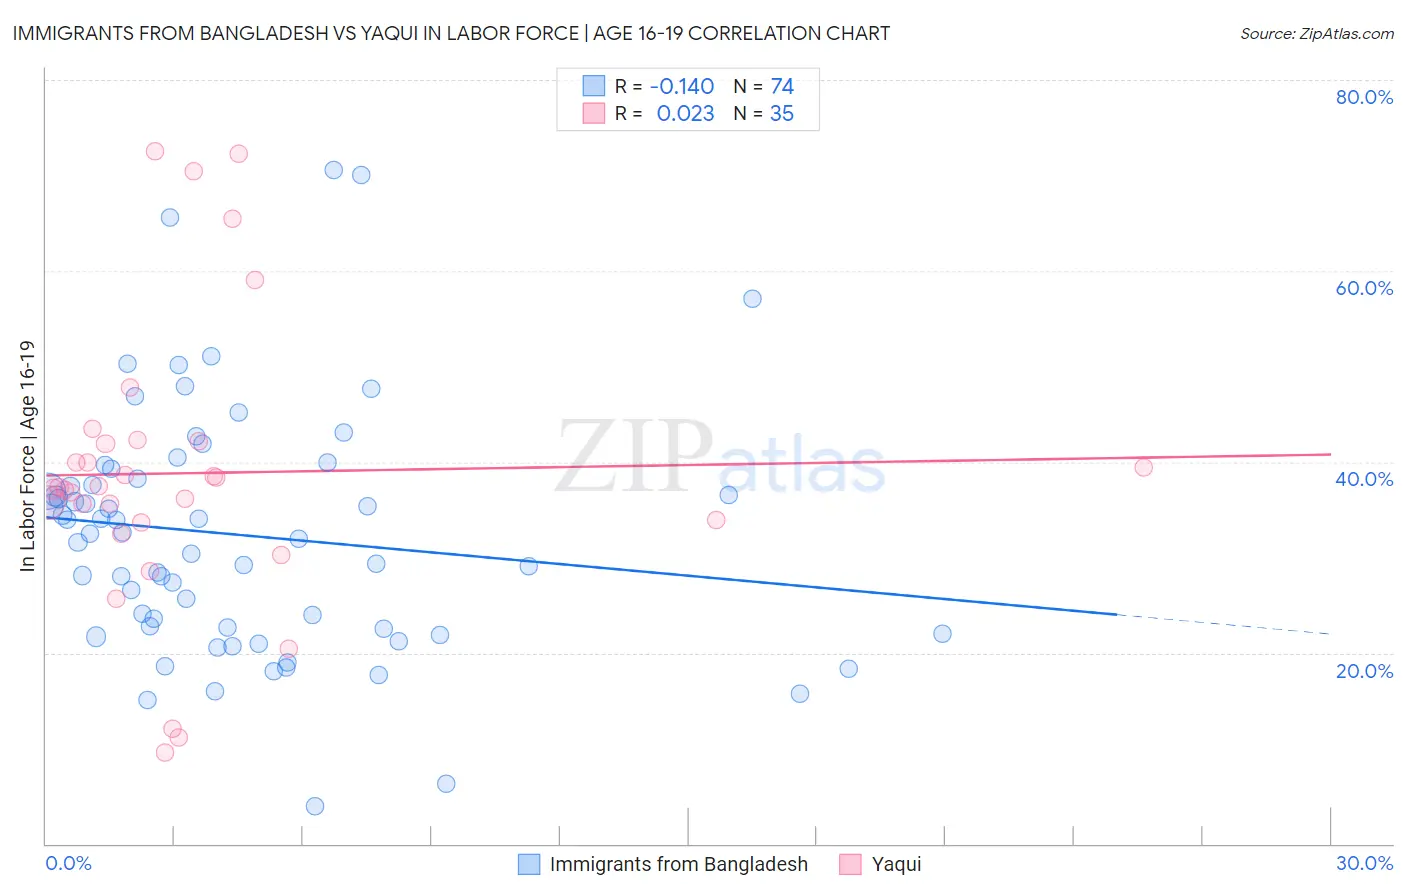
Immigrants from Bangladesh vs Yaqui In Labor Force | Age 16-19 Correlation Chart
The statistical analysis conducted on geographies consisting of 203,549,433 people shows a poor negative correlation between the proportion of Immigrants from Bangladesh and labor force participation rate among population between the ages 16 and 19 in the United States with a correlation coefficient (R) of -0.140 and weighted average of 30.0%. Similarly, the statistical analysis conducted on geographies consisting of 107,656,749 people shows no correlation between the proportion of Yaqui and labor force participation rate among population between the ages 16 and 19 in the United States with a correlation coefficient (R) of 0.023 and weighted average of 37.1%, a difference of 23.3%.
In Labor Force | Age 16-19 Correlation Summary
| Measurement | Immigrants from Bangladesh | Yaqui |
| Minimum | 3.9% | 9.5% |
| Maximum | 70.6% | 72.6% |
| Range | 66.7% | 63.1% |
| Mean | 32.3% | 38.8% |
| Median | 32.2% | 37.3% |
| Interquartile 25% (IQ1) | 22.5% | 33.7% |
| Interquartile 75% (IQ3) | 38.2% | 42.1% |
| Interquartile Range (IQR) | 15.7% | 8.4% |
| Standard Deviation (Sample) | 13.0% | 15.0% |
| Standard Deviation (Population) | 12.9% | 14.8% |
Similar Demographics by In Labor Force | Age 16-19
Demographics Similar to Immigrants from Bangladesh by In Labor Force | Age 16-19
In terms of in labor force | age 16-19, the demographic groups most similar to Immigrants from Bangladesh are Immigrants from Trinidad and Tobago (30.2%, a difference of 0.37%), Immigrants from Cuba (30.2%, a difference of 0.66%), Puerto Rican (30.3%, a difference of 0.99%), Immigrants from Hong Kong (30.5%, a difference of 1.4%), and Immigrants from Israel (30.5%, a difference of 1.4%).
| Demographics | Rating | Rank | In Labor Force | Age 16-19 |
| Lumbee | 0.0 /100 | #330 | Tragic 31.0% |
| Trinidadians and Tobagonians | 0.0 /100 | #331 | Tragic 30.9% |
| Immigrants | Israel | 0.0 /100 | #332 | Tragic 30.5% |
| Immigrants | Hong Kong | 0.0 /100 | #333 | Tragic 30.5% |
| Puerto Ricans | 0.0 /100 | #334 | Tragic 30.3% |
| Immigrants | Cuba | 0.0 /100 | #335 | Tragic 30.2% |
| Immigrants | Trinidad and Tobago | 0.0 /100 | #336 | Tragic 30.2% |
| Immigrants | Bangladesh | 0.0 /100 | #337 | Tragic 30.0% |
| Vietnamese | 0.0 /100 | #338 | Tragic 29.6% |
| Immigrants | Uzbekistan | 0.0 /100 | #339 | Tragic 29.2% |
| British West Indians | 0.0 /100 | #340 | Tragic 29.1% |
| Immigrants | Armenia | 0.0 /100 | #341 | Tragic 29.0% |
| Immigrants | Barbados | 0.0 /100 | #342 | Tragic 29.0% |
| Yuman | 0.0 /100 | #343 | Tragic 27.7% |
| Guyanese | 0.0 /100 | #344 | Tragic 27.4% |
Demographics Similar to Yaqui by In Labor Force | Age 16-19
In terms of in labor force | age 16-19, the demographic groups most similar to Yaqui are Immigrants from Saudi Arabia (37.0%, a difference of 0.030%), Ute (37.1%, a difference of 0.080%), Immigrants from Brazil (37.1%, a difference of 0.14%), Cambodian (37.0%, a difference of 0.18%), and Immigrants from Jordan (36.9%, a difference of 0.31%).
| Demographics | Rating | Rank | In Labor Force | Age 16-19 |
| Immigrants | Sierra Leone | 83.6 /100 | #152 | Excellent 37.3% |
| Arapaho | 81.8 /100 | #153 | Excellent 37.3% |
| Immigrants | Bulgaria | 81.6 /100 | #154 | Excellent 37.3% |
| Immigrants | Lithuania | 80.7 /100 | #155 | Excellent 37.2% |
| Kiowa | 80.4 /100 | #156 | Excellent 37.2% |
| Immigrants | Brazil | 76.5 /100 | #157 | Good 37.1% |
| Ute | 75.7 /100 | #158 | Good 37.1% |
| Yaqui | 74.4 /100 | #159 | Good 37.1% |
| Immigrants | Saudi Arabia | 73.9 /100 | #160 | Good 37.0% |
| Cambodians | 71.5 /100 | #161 | Good 37.0% |
| Immigrants | Jordan | 69.5 /100 | #162 | Good 36.9% |
| Bermudans | 69.3 /100 | #163 | Good 36.9% |
| Immigrants | Kuwait | 68.9 /100 | #164 | Good 36.9% |
| Yakama | 66.9 /100 | #165 | Good 36.9% |
| Immigrants | Western Africa | 66.7 /100 | #166 | Good 36.9% |