Immigrants from Australia vs Syrian In Labor Force | Age 16-19
COMPARE
Immigrants from Australia
Syrian
In Labor Force | Age 16-19
In Labor Force | Age 16-19 Comparison
Immigrants from Australia
Syrians
35.1%
IN LABOR FORCE | AGE 16-19
3.6/ 100
METRIC RATING
236th/ 347
METRIC RANK
37.6%
IN LABOR FORCE | AGE 16-19
90.7/ 100
METRIC RATING
141st/ 347
METRIC RANK
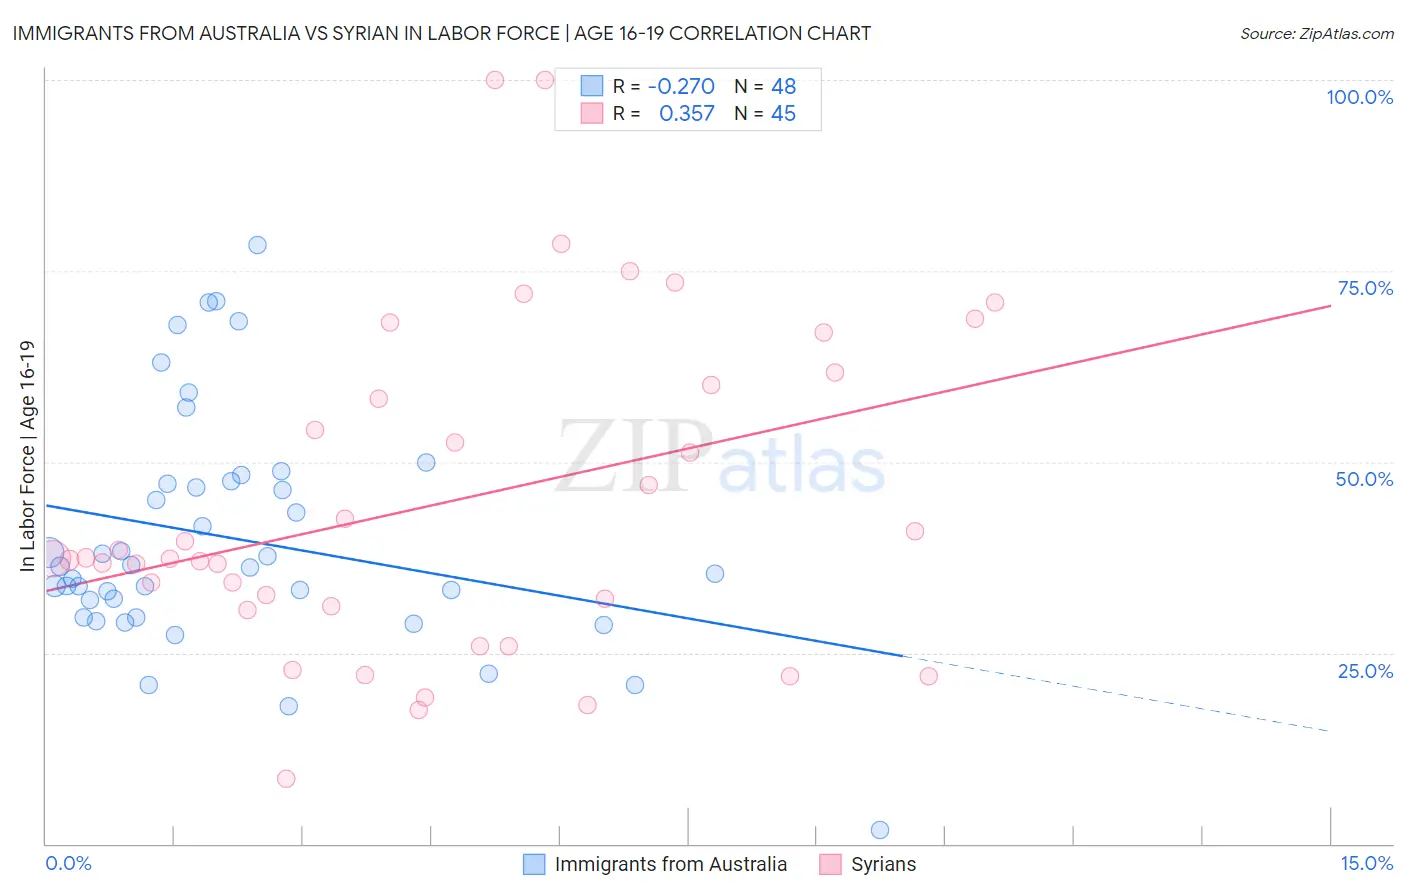
Immigrants from Australia vs Syrian In Labor Force | Age 16-19 Correlation Chart
The statistical analysis conducted on geographies consisting of 226,866,182 people shows a weak negative correlation between the proportion of Immigrants from Australia and labor force participation rate among population between the ages 16 and 19 in the United States with a correlation coefficient (R) of -0.270 and weighted average of 35.1%. Similarly, the statistical analysis conducted on geographies consisting of 266,042,941 people shows a mild positive correlation between the proportion of Syrians and labor force participation rate among population between the ages 16 and 19 in the United States with a correlation coefficient (R) of 0.357 and weighted average of 37.6%, a difference of 7.3%.
In Labor Force | Age 16-19 Correlation Summary
| Measurement | Immigrants from Australia | Syrian |
| Minimum | 1.8% | 8.6% |
| Maximum | 78.4% | 100.0% |
| Range | 76.6% | 91.4% |
| Mean | 39.9% | 44.8% |
| Median | 36.2% | 37.3% |
| Interquartile 25% (IQ1) | 30.8% | 30.9% |
| Interquartile 75% (IQ3) | 47.3% | 60.9% |
| Interquartile Range (IQR) | 16.5% | 30.0% |
| Standard Deviation (Sample) | 15.3% | 21.6% |
| Standard Deviation (Population) | 15.2% | 21.4% |
Similar Demographics by In Labor Force | Age 16-19
Demographics Similar to Immigrants from Australia by In Labor Force | Age 16-19
In terms of in labor force | age 16-19, the demographic groups most similar to Immigrants from Australia are Immigrants from India (35.0%, a difference of 0.030%), Immigrants from Vietnam (35.0%, a difference of 0.070%), Immigrants from Philippines (35.1%, a difference of 0.14%), Inupiat (35.0%, a difference of 0.16%), and Immigrants from Mexico (35.1%, a difference of 0.22%).
| Demographics | Rating | Rank | In Labor Force | Age 16-19 |
| Immigrants | Lebanon | 5.0 /100 | #229 | Tragic 35.2% |
| Immigrants | Honduras | 4.9 /100 | #230 | Tragic 35.2% |
| Immigrants | Syria | 4.5 /100 | #231 | Tragic 35.2% |
| Immigrants | Kazakhstan | 4.5 /100 | #232 | Tragic 35.2% |
| Immigrants | France | 4.3 /100 | #233 | Tragic 35.1% |
| Immigrants | Mexico | 4.2 /100 | #234 | Tragic 35.1% |
| Immigrants | Philippines | 4.0 /100 | #235 | Tragic 35.1% |
| Immigrants | Australia | 3.6 /100 | #236 | Tragic 35.1% |
| Immigrants | India | 3.5 /100 | #237 | Tragic 35.0% |
| Immigrants | Vietnam | 3.4 /100 | #238 | Tragic 35.0% |
| Inupiat | 3.2 /100 | #239 | Tragic 35.0% |
| Immigrants | Central America | 3.0 /100 | #240 | Tragic 35.0% |
| Immigrants | Ireland | 2.9 /100 | #241 | Tragic 35.0% |
| Uruguayans | 2.6 /100 | #242 | Tragic 34.9% |
| Pueblo | 2.6 /100 | #243 | Tragic 34.9% |
Demographics Similar to Syrians by In Labor Force | Age 16-19
In terms of in labor force | age 16-19, the demographic groups most similar to Syrians are Estonian (37.7%, a difference of 0.14%), Sierra Leonean (37.6%, a difference of 0.15%), Immigrants from Moldova (37.7%, a difference of 0.17%), Pakistani (37.6%, a difference of 0.18%), and Comanche (37.7%, a difference of 0.19%).
| Demographics | Rating | Rank | In Labor Force | Age 16-19 |
| Immigrants | Netherlands | 93.7 /100 | #134 | Exceptional 37.8% |
| Macedonians | 93.4 /100 | #135 | Exceptional 37.8% |
| Australians | 93.2 /100 | #136 | Exceptional 37.8% |
| Cajuns | 93.2 /100 | #137 | Exceptional 37.8% |
| Comanche | 91.9 /100 | #138 | Exceptional 37.7% |
| Immigrants | Moldova | 91.9 /100 | #139 | Exceptional 37.7% |
| Estonians | 91.7 /100 | #140 | Exceptional 37.7% |
| Syrians | 90.7 /100 | #141 | Exceptional 37.6% |
| Sierra Leoneans | 89.7 /100 | #142 | Excellent 37.6% |
| Pakistanis | 89.5 /100 | #143 | Excellent 37.6% |
| Japanese | 89.3 /100 | #144 | Excellent 37.5% |
| Paiute | 89.3 /100 | #145 | Excellent 37.5% |
| Immigrants | Western Europe | 88.9 /100 | #146 | Excellent 37.5% |
| Brazilians | 88.7 /100 | #147 | Excellent 37.5% |
| Romanians | 87.3 /100 | #148 | Excellent 37.5% |