Immigrants from Australia vs Cherokee In Labor Force | Age 30-34

COMPARE

Immigrants from Australia
Race
Ancestry
AfghanAfricanAlaska NativeAlaskan AthabascanAlbanianAleutAlsatianAmericanApacheArabArapahoArgentineanArmenianAssyrian/Chaldean/SyriacAustralianAustrianBahamianBangladeshiBarbadianBasqueBelgianBelizeanBermudanBhutaneseBlackfeetBolivianBrazilianBritishBritish West IndianBulgarianBurmeseCajunCambodianCanadianCape VerdeanCarpatho RusynCelticCentral AmericanCentral American IndianCheyenneChickasawChileanChineseChippewaChoctawColombianColvilleComancheCosta RicanCreeCreekCroatianCrowCubanCypriotCzechCzechoslovakianDanishDelawareDominicanDutchDutch West IndianEastern EuropeanEcuadorianEgyptianEnglishEstonianEthiopianEuropeanFijianFilipinoFinnishFrenchFrench American IndianFrench CanadianGermanGerman RussianGhanaianGreekGuamanian/ChamorroGuatemalanGuyaneseHaitianHmongHonduranHopiHoumaHungarianIcelanderIndian (Asian)IndonesianInupiatIranianIraqiIrishIroquoisIsraeliItalianJamaicanJapaneseJordanianKenyanKiowaKoreanLaotianLatvianLebaneseLiberianLithuanianLumbeeLuxembourgerMacedonianMalaysianMalteseMarshalleseMenomineeMexicanMexican American IndianMongolianMoroccanNative HawaiianNavajoNepaleseNew ZealanderNicaraguanNigerianNorthern EuropeanNorwegianOkinawanOsageOttawaPaiutePakistaniPalestinianPanamanianParaguayanPennsylvania GermanPeruvianPimaPolishPortuguesePotawatomiPuebloPuerto RicanPuget Sound SalishRomanianRussianSalvadoranSamoanScandinavianScotch-IrishScottishSeminoleSenegaleseSerbianShoshoneSierra LeoneanSiouxSlavicSlovakSloveneSomaliSouth AfricanSouth AmericanSouth American IndianSoviet UnionSpaniardSpanishSpanish AmericanSpanish American IndianSri LankanSubsaharan AfricanSudaneseSwedishSwissSyrianTaiwaneseThaiTlingit-HaidaTohono O'OdhamTonganTrinidadian and TobagonianTsimshianTurkishU.S. Virgin IslanderUgandanUkrainianUruguayanUteVenezuelanVietnameseWelshWest IndianYakamaYaquiYugoslavianYumanYup'ikZimbabwean
Immigration
NonimmigrantsImmigrantsAfghanistanAfricaAlbaniaArgentinaArmeniaAsiaAustraliaAustriaBahamasBangladeshBarbadosBelarusBelgiumBelizeBoliviaBosnia and HerzegovinaBrazilBulgariaBurma/MyanmarCabo VerdeCambodiaCameroonCanadaCaribbeanCentral AmericaChileChinaColombiaCongoCosta RicaCroatiaCubaCzechoslovakiaDenmarkDominicaDominican RepublicEastern AfricaEastern AsiaEastern EuropeEcuadorEgyptEl SalvadorEnglandEritreaEthiopiaEuropeFijiFranceGermanyGhanaGreeceGrenadaGuatemalaGuyanaHaitiHondurasHong KongHungaryIndiaIndonesiaIranIraqIrelandIsraelItalyJamaicaJapanJordanKazakhstanKenyaKoreaKuwaitLaosLatin AmericaLatviaLebanonLiberiaLithuaniaMalaysiaMexicoMicronesiaMiddle AfricaMoldovaMoroccoNepalNetherlandsNicaraguaNigeriaNorth AmericaNorth MacedoniaNorthern AfricaNorthern EuropeNorwayOceaniaPakistanPanamaPeruPhilippinesPolandPortugalRomaniaRussiaSaudi ArabiaScotlandSenegalSerbiaSierra LeoneSingaporeSomaliaSouth AfricaSouth AmericaSouth Central AsiaSouth Eastern AsiaSouthern EuropeSpainSri LankaSt. Vincent and the GrenadinesSudanSwedenSwitzerlandSyriaTaiwanThailandTrinidad and TobagoTurkeyUgandaUkraineUruguayUzbekistanVenezuelaVietnamWest IndiesWestern AfricaWestern AsiaWestern EuropeYemenZaireZimbabweAzores
Cherokee
Race
Ancestry
AfghanAfricanAlaska NativeAlaskan AthabascanAlbanianAleutAlsatianAmericanApacheArabArapahoArgentineanArmenianAssyrian/Chaldean/SyriacAustralianAustrianBahamianBangladeshiBarbadianBasqueBelgianBelizeanBermudanBhutaneseBlackfeetBolivianBrazilianBritishBritish West IndianBulgarianBurmeseCajunCambodianCanadianCape VerdeanCarpatho RusynCelticCentral AmericanCentral American IndianCherokeeCheyenneChickasawChileanChineseChippewaChoctawColombianColvilleComancheCosta RicanCreeCreekCroatianCrowCubanCypriotCzechCzechoslovakianDanishDelawareDominicanDutchDutch West IndianEastern EuropeanEcuadorianEgyptianEnglishEstonianEthiopianEuropeanFijianFilipinoFinnishFrenchFrench American IndianFrench CanadianGermanGerman RussianGhanaianGreekGuamanian/ChamorroGuatemalanGuyaneseHaitianHmongHonduranHopiHoumaHungarianIcelanderIndian (Asian)IndonesianInupiatIranianIraqiIrishIroquoisIsraeliItalianJamaicanJapaneseJordanianKenyanKiowaKoreanLaotianLatvianLebaneseLiberianLithuanianLumbeeLuxembourgerMacedonianMalaysianMalteseMarshalleseMenomineeMexicanMexican American IndianMongolianMoroccanNative HawaiianNavajoNepaleseNew ZealanderNicaraguanNigerianNorthern EuropeanNorwegianOkinawanOsageOttawaPaiutePakistaniPalestinianPanamanianParaguayanPennsylvania GermanPeruvianPimaPolishPortuguesePotawatomiPuebloPuerto RicanPuget Sound SalishRomanianRussianSalvadoranSamoanScandinavianScotch-IrishScottishSeminoleSenegaleseSerbianShoshoneSierra LeoneanSiouxSlavicSlovakSloveneSomaliSouth AfricanSouth AmericanSouth American IndianSoviet UnionSpaniardSpanishSpanish AmericanSpanish American IndianSri LankanSubsaharan AfricanSudaneseSwedishSwissSyrianTaiwaneseThaiTlingit-HaidaTohono O'OdhamTonganTrinidadian and TobagonianTsimshianTurkishU.S. Virgin IslanderUgandanUkrainianUruguayanUteVenezuelanVietnameseWelshWest IndianYakamaYaquiYugoslavianYumanYup'ikZimbabwean
Immigration
NonimmigrantsImmigrantsAfghanistanAfricaAlbaniaArgentinaArmeniaAsiaAustriaBahamasBangladeshBarbadosBelarusBelgiumBelizeBoliviaBosnia and HerzegovinaBrazilBulgariaBurma/MyanmarCabo VerdeCambodiaCameroonCanadaCaribbeanCentral AmericaChileChinaColombiaCongoCosta RicaCroatiaCubaCzechoslovakiaDenmarkDominicaDominican RepublicEastern AfricaEastern AsiaEastern EuropeEcuadorEgyptEl SalvadorEnglandEritreaEthiopiaEuropeFijiFranceGermanyGhanaGreeceGrenadaGuatemalaGuyanaHaitiHondurasHong KongHungaryIndiaIndonesiaIranIraqIrelandIsraelItalyJamaicaJapanJordanKazakhstanKenyaKoreaKuwaitLaosLatin AmericaLatviaLebanonLiberiaLithuaniaMalaysiaMexicoMicronesiaMiddle AfricaMoldovaMoroccoNepalNetherlandsNicaraguaNigeriaNorth AmericaNorth MacedoniaNorthern AfricaNorthern EuropeNorwayOceaniaPakistanPanamaPeruPhilippinesPolandPortugalRomaniaRussiaSaudi ArabiaScotlandSenegalSerbiaSierra LeoneSingaporeSomaliaSouth AfricaSouth AmericaSouth Central AsiaSouth Eastern AsiaSouthern EuropeSpainSri LankaSt. Vincent and the GrenadinesSudanSwedenSwitzerlandSyriaTaiwanThailandTrinidad and TobagoTurkeyUgandaUkraineUruguayUzbekistanVenezuelaVietnamWest IndiesWestern AfricaWestern AsiaWestern EuropeYemenZaireZimbabweAzores
In Labor Force | Age 30-34
Income
Poverty
Unemployment
Labor Participation
Family Structure
Vehicle Availability
Education Level
Disability

In Labor Force | Age 30-34 Comparison

Immigrants from Australia

Cherokee

Exceptional
Tragic
85.6%
IN LABOR FORCE | AGE 30-34
99.8/ 100
METRIC RATING
50th/ 347
METRIC RANK
81.6%
IN LABOR FORCE | AGE 30-34
0.0/ 100
METRIC RATING
315th/ 347
METRIC RANK

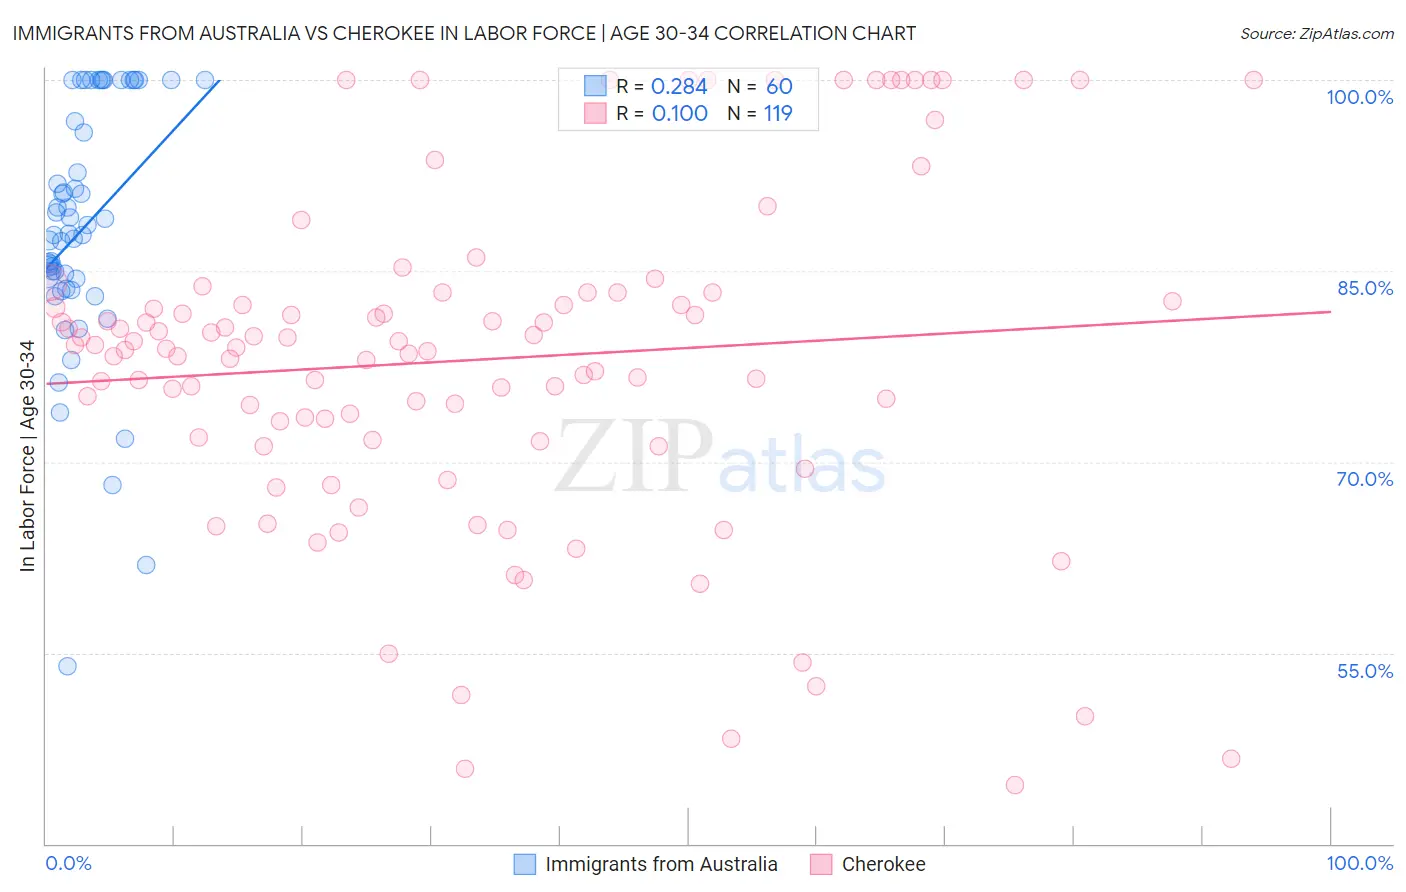
Immigrants from Australia vs Cherokee In Labor Force | Age 30-34 Correlation Chart

The statistical analysis conducted on geographies consisting of 227,147,173 people shows a weak positive correlation between the proportion of Immigrants from Australia and labor force participation rate among population between the ages 30 and 34 in the United States with a correlation coefficient (R) of 0.284 and weighted average of 85.6%. Similarly, the statistical analysis conducted on geographies consisting of 493,185,438 people shows a poor positive correlation between the proportion of Cherokee and labor force participation rate among population between the ages 30 and 34 in the United States with a correlation coefficient (R) of 0.100 and weighted average of 81.6%, a difference of 4.9%.
Immigrants from Australia vs Cherokee In Labor Force | Age 30-34

In Labor Force | Age 30-34 Correlation Summary

MeasurementImmigrants from AustraliaCherokee
Minimum53.9%44.6%
Maximum100.0%100.0%
Range46.1%55.4%
Mean88.3%78.0%
Median87.9%79.0%
Interquartile 25% (IQ1)84.0%71.7%
Interquartile 75% (IQ3)98.4%83.3%
Interquartile Range (IQR)14.4%11.6%
Standard Deviation (Sample)9.8%13.1%
Standard Deviation (Population)9.7%13.0%

Similar Demographics by In Labor Force | Age 30-34

Demographics Similar to Immigrants from Australia by In Labor Force | Age 30-34

In terms of in labor force | age 30-34, the demographic groups most similar to Immigrants from Australia are Immigrants from Sweden (85.6%, a difference of 0.010%), Lithuanian (85.6%, a difference of 0.010%), Cape Verdean (85.6%, a difference of 0.020%), Immigrants from Morocco (85.6%, a difference of 0.030%), and Croatian (85.6%, a difference of 0.030%).
DemographicsRating | RankIn Labor Force | Age 30-34
Immigrants | Lithuania
99.8
/100
|
#43
Exceptional
85.6%
Immigrants | Sri Lanka
99.8
/100
|
#44
Exceptional
85.6%
Immigrants | Nepal
99.8
/100
|
#45
Exceptional
85.6%
Immigrants | Morocco
99.8
/100
|
#46
Exceptional
85.6%
Croatians
99.8
/100
|
#47
Exceptional
85.6%
Immigrants | Sweden
99.8
/100
|
#48
Exceptional
85.6%
Lithuanians
99.8
/100
|
#49
Exceptional
85.6%
Immigrants | Australia
99.8
/100
|
#50
Exceptional
85.6%
Cape Verdeans
99.7
/100
|
#51
Exceptional
85.6%
Slovenes
99.7
/100
|
#52
Exceptional
85.6%
Filipinos
99.6
/100
|
#53
Exceptional
85.5%
Immigrants | Kenya
99.6
/100
|
#54
Exceptional
85.5%
Immigrants | Turkey
99.6
/100
|
#55
Exceptional
85.5%
Czechs
99.6
/100
|
#56
Exceptional
85.5%
Russians
99.6
/100
|
#57
Exceptional
85.5%

Demographics Similar to Cherokee by In Labor Force | Age 30-34

In terms of in labor force | age 30-34, the demographic groups most similar to Cherokee are Alaskan Athabascan (81.7%, a difference of 0.10%), Immigrants from the Azores (81.5%, a difference of 0.15%), Arapaho (81.5%, a difference of 0.16%), Choctaw (81.4%, a difference of 0.23%), and Shoshone (81.4%, a difference of 0.24%).
DemographicsRating | RankIn Labor Force | Age 30-34
Puget Sound Salish
0.0
/100
|
#308
Tragic
82.1%
Immigrants | Mexico
0.0
/100
|
#309
Tragic
82.0%
Cajuns
0.0
/100
|
#310
Tragic
82.0%
Chickasaw
0.0
/100
|
#311
Tragic
81.9%
Mexicans
0.0
/100
|
#312
Tragic
81.9%
Iroquois
0.0
/100
|
#313
Tragic
81.9%
Alaskan Athabascans
0.0
/100
|
#314
Tragic
81.7%
Cherokee
0.0
/100
|
#315
Tragic
81.6%
Immigrants | Azores
0.0
/100
|
#316
Tragic
81.5%
Arapaho
0.0
/100
|
#317
Tragic
81.5%
Choctaw
0.0
/100
|
#318
Tragic
81.4%
Shoshone
0.0
/100
|
#319
Tragic
81.4%
Yaqui
0.0
/100
|
#320
Tragic
81.4%
Alaska Natives
0.0
/100
|
#321
Tragic
81.3%
Puerto Ricans
0.0
/100
|
#322
Tragic
81.2%