Immigrants from Argentina vs Ghanaian In Labor Force | Age > 16
COMPARE
Immigrants from Argentina
Ghanaian
In Labor Force | Age > 16
In Labor Force | Age > 16 Comparison
Immigrants from Argentina
Ghanaians
65.6%
IN LABOR FORCE | AGE > 16
92.4/ 100
METRIC RATING
136th/ 347
METRIC RANK
67.1%
IN LABOR FORCE | AGE > 16
100.0/ 100
METRIC RATING
31st/ 347
METRIC RANK
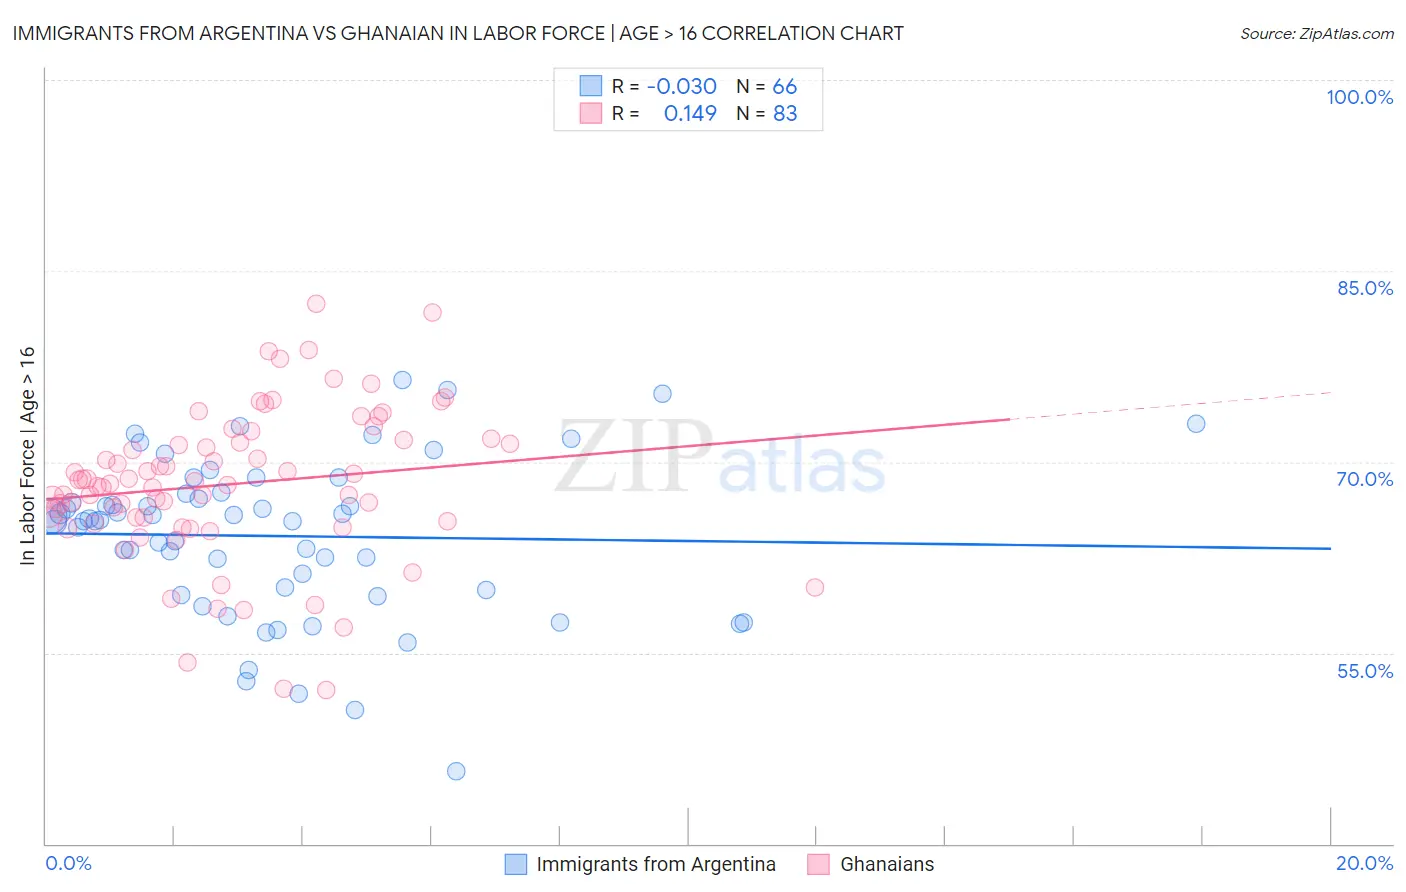
Immigrants from Argentina vs Ghanaian In Labor Force | Age > 16 Correlation Chart
The statistical analysis conducted on geographies consisting of 264,438,134 people shows no correlation between the proportion of Immigrants from Argentina and labor force participation rate among population ages 16 and over in the United States with a correlation coefficient (R) of -0.030 and weighted average of 65.6%. Similarly, the statistical analysis conducted on geographies consisting of 190,727,867 people shows a poor positive correlation between the proportion of Ghanaians and labor force participation rate among population ages 16 and over in the United States with a correlation coefficient (R) of 0.149 and weighted average of 67.1%, a difference of 2.4%.
In Labor Force | Age > 16 Correlation Summary
| Measurement | Immigrants from Argentina | Ghanaian |
| Minimum | 45.7% | 52.1% |
| Maximum | 76.4% | 82.4% |
| Range | 30.7% | 30.3% |
| Mean | 64.2% | 68.2% |
| Median | 65.4% | 68.3% |
| Interquartile 25% (IQ1) | 59.9% | 65.3% |
| Interquartile 75% (IQ3) | 67.5% | 71.7% |
| Interquartile Range (IQR) | 7.6% | 6.4% |
| Standard Deviation (Sample) | 6.3% | 5.9% |
| Standard Deviation (Population) | 6.2% | 5.9% |
Similar Demographics by In Labor Force | Age > 16
Demographics Similar to Immigrants from Argentina by In Labor Force | Age > 16
In terms of in labor force | age > 16, the demographic groups most similar to Immigrants from Argentina are Guatemalan (65.6%, a difference of 0.0%), Guamanian/Chamorro (65.6%, a difference of 0.0%), Immigrants from West Indies (65.6%, a difference of 0.020%), Costa Rican (65.6%, a difference of 0.030%), and Immigrants from Lithuania (65.6%, a difference of 0.040%).
| Demographics | Rating | Rank | In Labor Force | Age > 16 |
| Immigrants | Philippines | 94.5 /100 | #129 | Exceptional 65.6% |
| Immigrants | Guatemala | 94.4 /100 | #130 | Exceptional 65.6% |
| Icelanders | 94.3 /100 | #131 | Exceptional 65.6% |
| Immigrants | North Macedonia | 94.1 /100 | #132 | Exceptional 65.6% |
| Immigrants | Lithuania | 93.5 /100 | #133 | Exceptional 65.6% |
| Costa Ricans | 93.2 /100 | #134 | Exceptional 65.6% |
| Guatemalans | 92.5 /100 | #135 | Exceptional 65.6% |
| Immigrants | Argentina | 92.4 /100 | #136 | Exceptional 65.6% |
| Guamanians/Chamorros | 92.4 /100 | #137 | Exceptional 65.6% |
| Immigrants | West Indies | 92.0 /100 | #138 | Exceptional 65.6% |
| Immigrants | Taiwan | 90.8 /100 | #139 | Exceptional 65.5% |
| Immigrants | Costa Rica | 90.8 /100 | #140 | Exceptional 65.5% |
| Samoans | 90.5 /100 | #141 | Exceptional 65.5% |
| Indians (Asian) | 89.5 /100 | #142 | Excellent 65.5% |
| Latvians | 89.4 /100 | #143 | Excellent 65.5% |
Demographics Similar to Ghanaians by In Labor Force | Age > 16
In terms of in labor force | age > 16, the demographic groups most similar to Ghanaians are Immigrants from Congo (67.1%, a difference of 0.060%), Afghan (67.1%, a difference of 0.060%), Immigrants from Ghana (67.1%, a difference of 0.070%), Immigrants from Zaire (67.2%, a difference of 0.10%), and Thai (67.2%, a difference of 0.11%).
| Demographics | Rating | Rank | In Labor Force | Age > 16 |
| Ugandans | 100.0 /100 | #24 | Exceptional 67.4% |
| Immigrants | Africa | 100.0 /100 | #25 | Exceptional 67.4% |
| Immigrants | Cabo Verde | 100.0 /100 | #26 | Exceptional 67.3% |
| Zimbabweans | 100.0 /100 | #27 | Exceptional 67.3% |
| Immigrants | Morocco | 100.0 /100 | #28 | Exceptional 67.2% |
| Thais | 100.0 /100 | #29 | Exceptional 67.2% |
| Immigrants | Zaire | 100.0 /100 | #30 | Exceptional 67.2% |
| Ghanaians | 100.0 /100 | #31 | Exceptional 67.1% |
| Immigrants | Congo | 100.0 /100 | #32 | Exceptional 67.1% |
| Afghans | 100.0 /100 | #33 | Exceptional 67.1% |
| Immigrants | Ghana | 100.0 /100 | #34 | Exceptional 67.1% |
| Immigrants | South Central Asia | 100.0 /100 | #35 | Exceptional 67.1% |
| Immigrants | Western Africa | 100.0 /100 | #36 | Exceptional 67.1% |
| Immigrants | Afghanistan | 100.0 /100 | #37 | Exceptional 67.0% |
| Immigrants | Nigeria | 100.0 /100 | #38 | Exceptional 66.9% |